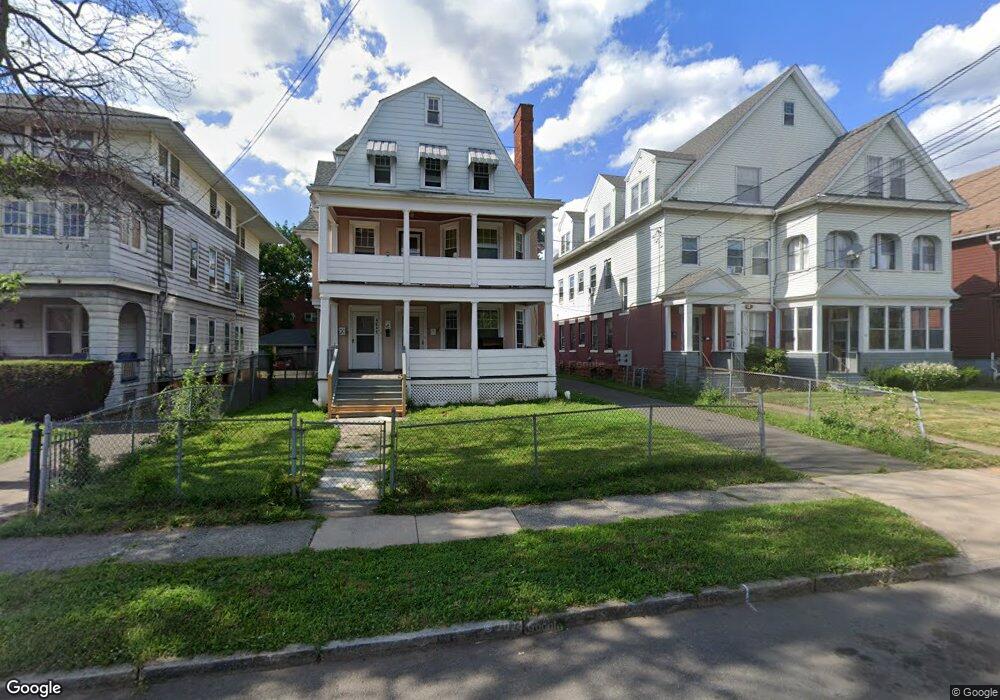
46 Shultas Place Unit 2 Hartford, CT 06114
Barry Square NeighborhoodEstimated Value: $405,932 - $481,000
3
Beds
1
Bath
3,850
Sq Ft
$117/Sq Ft
Est. Value
About This Home
This home is located at 46 Shultas Place Unit 2, Hartford, CT 06114 and is currently estimated at $449,233, approximately $116 per square foot. 46 Shultas Place Unit 2 is a home located in Hartford County with nearby schools including M. D. Fox School, Asian Studies School At Dwight/Belizzi School, and Dr. James H Naylor/Ccsu Leadership Academy.
Ownership History
Date
Name
Owned For
Owner Type
Purchase Details
Closed on
Sep 7, 2023
Sold by
Khedaru Mashum and Khedaru Zoina
Bought by
Willams Jacqueline S
Current Estimated Value
Home Financials for this Owner
Home Financials are based on the most recent Mortgage that was taken out on this home.
Original Mortgage
$366,300
Outstanding Balance
$357,046
Interest Rate
6.25%
Mortgage Type
FHA
Estimated Equity
$92,187
Purchase Details
Closed on
Dec 7, 2005
Sold by
Bednarz David
Bought by
Khedaru Mashum and Khedaru Zorina
Home Financials for this Owner
Home Financials are based on the most recent Mortgage that was taken out on this home.
Original Mortgage
$195,920
Interest Rate
6.17%
Mortgage Type
Purchase Money Mortgage
Create a Home Valuation Report for This Property
The Home Valuation Report is an in-depth analysis detailing your home's value as well as a comparison with similar homes in the area
Home Values in the Area
Average Home Value in this Area
Purchase History
| Date | Buyer | Sale Price | Title Company |
|---|---|---|---|
| Willams Jacqueline S | -- | None Available | |
| Willams Jacqueline S | -- | None Available | |
| Khedaru Mashum | $244,900 | -- | |
| Khedaru Mashum | $244,900 | -- |
Source: Public Records
Mortgage History
| Date | Status | Borrower | Loan Amount |
|---|---|---|---|
| Open | Willams Jacqueline S | $366,300 | |
| Closed | Willams Jacqueline S | $366,300 | |
| Previous Owner | Khedaru Mashum | $195,920 | |
| Previous Owner | Khedaru Mashum | $48,480 |
Source: Public Records
Tax History Compared to Growth
Tax History
| Year | Tax Paid | Tax Assessment Tax Assessment Total Assessment is a certain percentage of the fair market value that is determined by local assessors to be the total taxable value of land and additions on the property. | Land | Improvement |
|---|---|---|---|---|
| 2025 | $6,875 | $99,703 | $6,468 | $93,235 |
| 2024 | $6,875 | $99,703 | $6,468 | $93,235 |
| 2023 | $6,875 | $99,703 | $6,468 | $93,235 |
| 2022 | $6,875 | $99,703 | $6,468 | $93,235 |
| 2021 | $4,423 | $59,535 | $8,540 | $50,995 |
| 2020 | $4,423 | $59,535 | $8,540 | $50,995 |
| 2019 | $4,423 | $59,535 | $8,540 | $50,995 |
| 2018 | $4,274 | $57,528 | $8,252 | $49,276 |
| 2016 | $4,128 | $55,562 | $7,859 | $47,703 |
| 2015 | $3,932 | $52,923 | $7,486 | $45,437 |
| 2014 | $3,836 | $51,629 | $7,303 | $44,326 |
Source: Public Records
Map
Nearby Homes
- 30 Shultas Place Unit 32
- 49 Benton St
- 3 Pawtucket St
- 71 Franklin Ave
- 10 Warner St
- 356 Wethersfield Ave
- 213 Franklin Ave Unit 405
- 68 Morris St Unit 102
- 67 Congress St Unit C
- 17 Bond St
- 15 Bond St
- 51 Congress St Unit A
- 31 Wethersfield Ave Unit I
- 18 School St Unit 20
- 14 Wethersfield Ave
- 2 Wethersfield Ave
- 27 Allen Place
- 34 Lisbon St
- 9 Madison St
- 155 Seymour St Unit 157
- 46 Shultas Place Unit 48
- 42 Shultas Place Unit 44
- 50 Shultas Place Unit 52
- 38 Shultas Place Unit 40
- 41 Shultas Place
- 43 Shultas Place Unit 43-1
- 43 Shultas Place
- 45 Shultas Place
- 45-47 Shultas Place
- 36 Shultas Place
- 39 Shultas Place Unit 3
- 39 Shultas Place Unit 3L
- 39 Shultas Place Unit 3R
- 39 Shultas Place Unit 1L
- 53 Shultas Place Unit 55
- 54 Shultas Place Unit 56
- 58 Shultas Place Unit 60
- 49-51 Shultas Place
- 29 Annawan St Unit D5
- 33 Shultas Place Unit 35