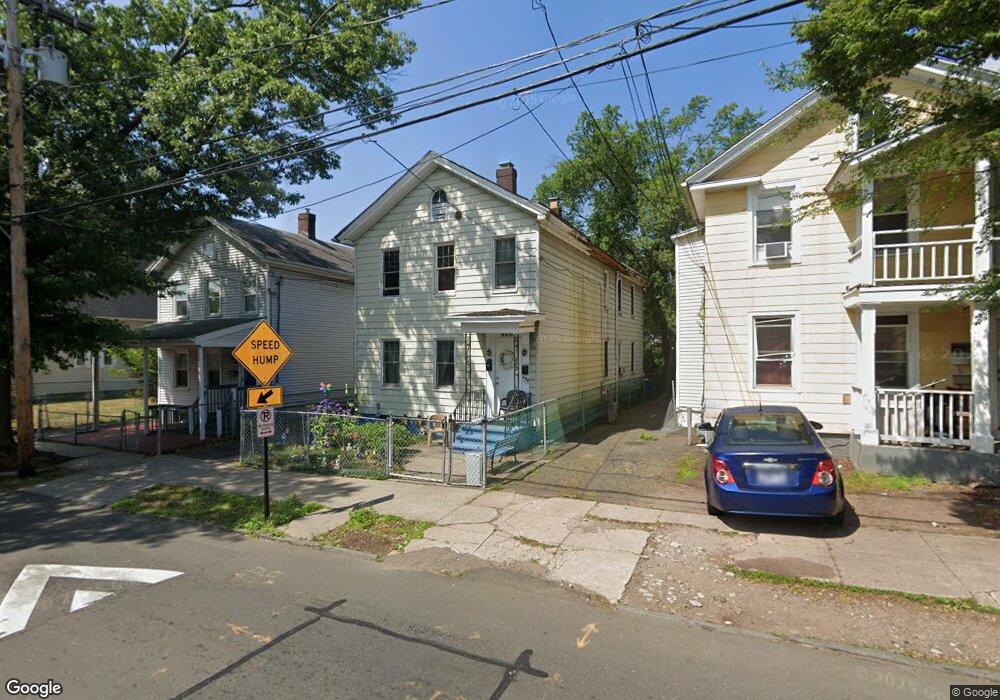
460 Blatchley Ave New Haven, CT 06513
Fair Haven NeighborhoodEstimated Value: $269,702 - $405,000
3
Beds
2
Baths
1,880
Sq Ft
$169/Sq Ft
Est. Value
About This Home
This home is located at 460 Blatchley Ave, New Haven, CT 06513 and is currently estimated at $318,426, approximately $169 per square foot. 460 Blatchley Ave is a home located in New Haven County with nearby schools including Clinton Avenue School, Elm City College Preparatory School, and St Francis & St Rose Of Lima School.
Ownership History
Date
Name
Owned For
Owner Type
Purchase Details
Closed on
Apr 3, 2019
Sold by
Chadha Paul
Bought by
Cheng Ethan
Current Estimated Value
Purchase Details
Closed on
Sep 29, 2010
Sold by
Department Of Housing & Urban Dev
Bought by
Chadha Paul
Purchase Details
Closed on
Feb 8, 2010
Sold by
Citimortgage Inc
Bought by
Department Of Housing & Urban Dev
Purchase Details
Closed on
Dec 31, 2009
Sold by
Nieves Luz
Bought by
Citimortgage Inc
Purchase Details
Closed on
Mar 14, 2007
Sold by
Mongillo Roxanne and Dichello Deborah
Bought by
Diaz Jose and Nieves Luz
Home Financials for this Owner
Home Financials are based on the most recent Mortgage that was taken out on this home.
Original Mortgage
$167,475
Interest Rate
6.4%
Purchase Details
Closed on
Mar 8, 1995
Sold by
Madonna Pauline
Bought by
Decesare Rose and Mongillo Roxanne
Create a Home Valuation Report for This Property
The Home Valuation Report is an in-depth analysis detailing your home's value as well as a comparison with similar homes in the area
Home Values in the Area
Average Home Value in this Area
Purchase History
| Date | Buyer | Sale Price | Title Company |
|---|---|---|---|
| Cheng Ethan | $130,000 | -- | |
| Chadha Paul | $50,000 | -- | |
| Department Of Housing & Urban Dev | -- | -- | |
| Citimortgage Inc | -- | -- | |
| Diaz Jose | $175,000 | -- | |
| Decesare Rose | $30,000 | -- |
Source: Public Records
Mortgage History
| Date | Status | Borrower | Loan Amount |
|---|---|---|---|
| Previous Owner | Decesare Rose | $23,648 | |
| Previous Owner | Decesare Rose | $167,475 |
Source: Public Records
Tax History Compared to Growth
Tax History
| Year | Tax Paid | Tax Assessment Tax Assessment Total Assessment is a certain percentage of the fair market value that is determined by local assessors to be the total taxable value of land and additions on the property. | Land | Improvement |
|---|---|---|---|---|
| 2025 | $4,929 | $125,090 | $26,600 | $98,490 |
| 2024 | $4,816 | $125,090 | $26,600 | $98,490 |
| 2023 | $4,653 | $125,090 | $26,600 | $98,490 |
| 2022 | $4,972 | $125,090 | $26,600 | $98,490 |
| 2021 | $3,201 | $72,940 | $21,280 | $51,660 |
| 2020 | $3,201 | $72,940 | $21,280 | $51,660 |
| 2019 | $3,135 | $72,940 | $21,280 | $51,660 |
| 2018 | $3,135 | $72,940 | $21,280 | $51,660 |
| 2017 | $2,821 | $72,940 | $21,280 | $51,660 |
| 2016 | $2,379 | $57,260 | $14,210 | $43,050 |
| 2015 | $2,379 | $57,260 | $14,210 | $43,050 |
| 2014 | $2,379 | $57,260 | $14,210 | $43,050 |
Source: Public Records
Map
Nearby Homes
- 458 Blatchley Ave
- 479 Lombard St
- 459 Blatchley Ave
- 459 Blatchley Ave Unit 2
- 360 Peck St
- 352 Peck St
- 463 Blatchley Ave
- 465 Blatchley Ave
- 473 Lombard St
- 344 Peck St
- 465 Lombard St
- 465 Lombard St Unit 2ND Floor
- 341 Peck St Unit 7
- 345 Peck St
- 529 Lombard St
- 504 Lombard St
- 355 Peck St
- 492 Lombard St
- 176 Monroe St
- 461 Lombard St