Estimated Value: $210,000 - $234,709
3
Beds
3
Baths
1,860
Sq Ft
$122/Sq Ft
Est. Value
About This Home
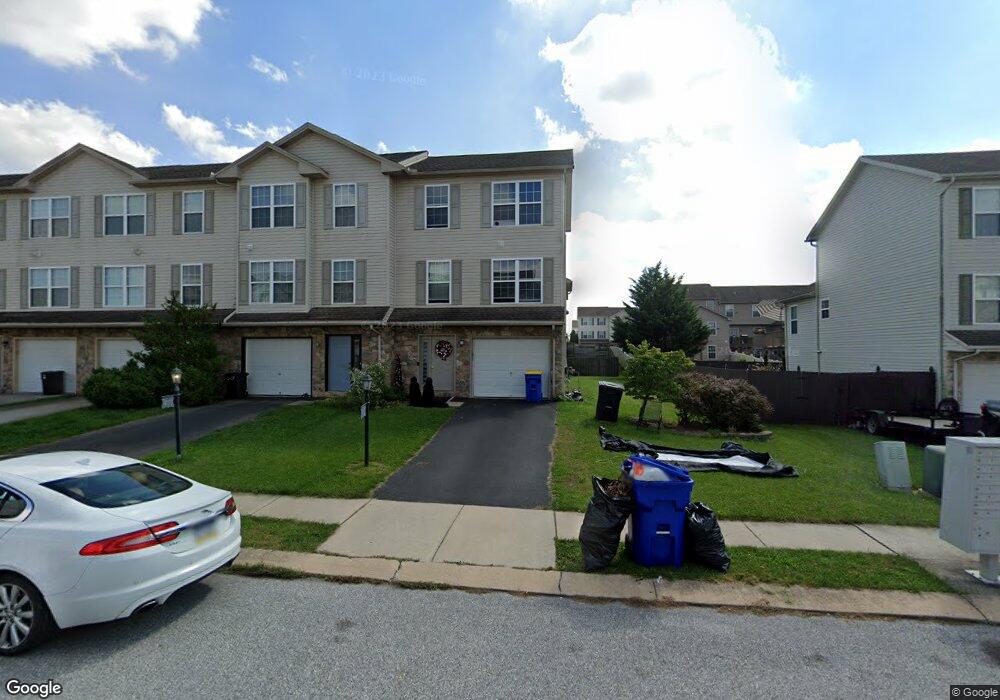
This home is located at 460 Fisher Dr, York, PA 17404 and is currently estimated at $227,177, approximately $122 per square foot. 460 Fisher Dr is a home located in York County with nearby schools including Northeastern Senior High School and Bible Baptist Christian Academy.
Ownership History
Date
Name
Owned For
Owner Type
Purchase Details
Closed on
Apr 11, 2022
Sold by
Vonaxelson William B and Vonaxelson Kathryn L
Bought by
Howell Shaquira and Howell Jarrod
Current Estimated Value
Home Financials for this Owner
Home Financials are based on the most recent Mortgage that was taken out on this home.
Original Mortgage
$175,757
Outstanding Balance
$164,215
Interest Rate
3.76%
Mortgage Type
New Conventional
Estimated Equity
$62,962
Purchase Details
Closed on
Jun 29, 2005
Sold by
S & A Custom Built Homes Inc
Bought by
Vonaxelson William B and Von Axelson Kathryn L
Home Financials for this Owner
Home Financials are based on the most recent Mortgage that was taken out on this home.
Original Mortgage
$113,100
Interest Rate
5.75%
Mortgage Type
Fannie Mae Freddie Mac
Purchase Details
Closed on
Nov 17, 2004
Sold by
F T Lllp
Bought by
S & A Custom Built Homes Inc
Create a Home Valuation Report for This Property
The Home Valuation Report is an in-depth analysis detailing your home's value as well as a comparison with similar homes in the area
Home Values in the Area
Average Home Value in this Area
Purchase History
| Date | Buyer | Sale Price | Title Company |
|---|---|---|---|
| Howell Shaquira | $174,000 | -- | |
| Vonaxelson William B | $141,430 | -- | |
| S & A Custom Built Homes Inc | $228,000 | -- |
Source: Public Records
Mortgage History
| Date | Status | Borrower | Loan Amount |
|---|---|---|---|
| Open | Howell Shaquira | $175,757 | |
| Previous Owner | Vonaxelson William B | $113,100 |
Source: Public Records
Tax History Compared to Growth
Tax History
| Year | Tax Paid | Tax Assessment Tax Assessment Total Assessment is a certain percentage of the fair market value that is determined by local assessors to be the total taxable value of land and additions on the property. | Land | Improvement |
|---|---|---|---|---|
| 2025 | $4,876 | $135,660 | $28,440 | $107,220 |
| 2024 | $4,766 | $135,660 | $28,440 | $107,220 |
| 2023 | $4,766 | $135,660 | $28,440 | $107,220 |
| 2022 | $4,736 | $135,660 | $28,440 | $107,220 |
| 2021 | $4,606 | $135,660 | $28,440 | $107,220 |
| 2020 | $4,606 | $135,660 | $28,440 | $107,220 |
| 2019 | $4,545 | $135,660 | $28,440 | $107,220 |
| 2018 | $4,523 | $135,660 | $28,440 | $107,220 |
| 2017 | $4,523 | $135,660 | $28,440 | $107,220 |
| 2016 | $0 | $135,660 | $28,440 | $107,220 |
| 2015 | -- | $135,660 | $28,440 | $107,220 |
| 2014 | -- | $135,660 | $28,440 | $107,220 |
Source: Public Records
Map
Nearby Homes