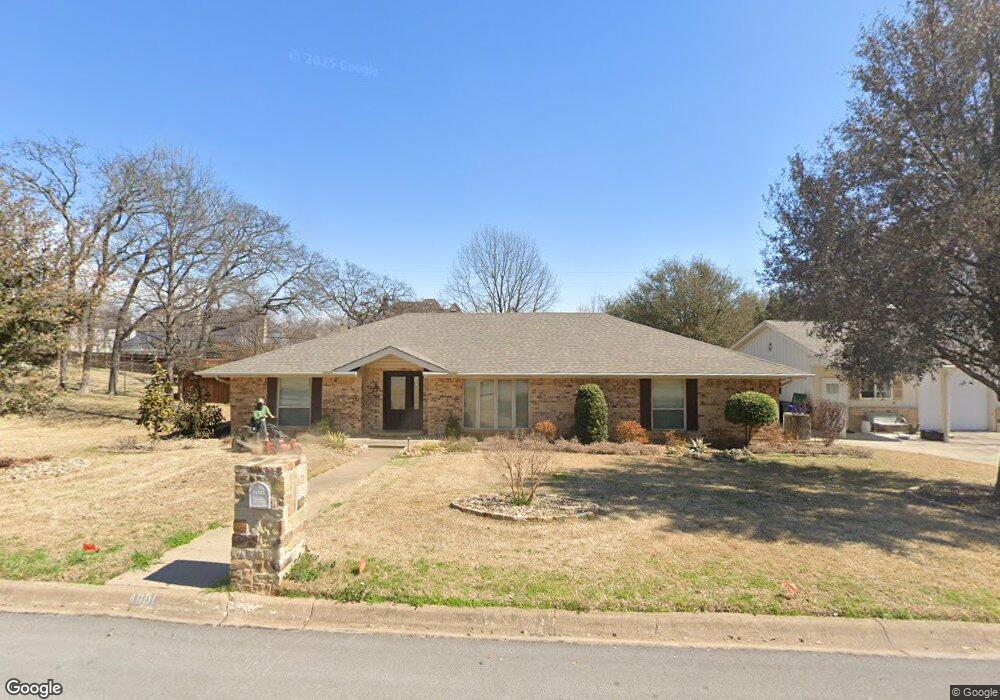
4601 Jim Mitchell Trail E Colleyville, TX 76034
Estimated Value: $751,021 - $809,000
3
Beds
3
Baths
2,268
Sq Ft
$344/Sq Ft
Est. Value
About This Home
This home is located at 4601 Jim Mitchell Trail E, Colleyville, TX 76034 and is currently estimated at $780,255, approximately $344 per square foot. 4601 Jim Mitchell Trail E is a home located in Tarrant County with nearby schools including O.C. Taylor Elementary School, Colleyville Middle School, and Waypoint Montessori.
Ownership History
Date
Name
Owned For
Owner Type
Purchase Details
Closed on
Feb 11, 2019
Sold by
Obrien Terrye Jo
Bought by
Obrien Terrye Jo and Terrye Obrien Revocable Trust
Current Estimated Value
Purchase Details
Closed on
Nov 28, 2017
Sold by
Westbrook Elizabeth Gallrrein and Westbrook Matt Thompson
Bought by
Allen Lee Wayne and Brien Terrye Jo O
Purchase Details
Closed on
Aug 28, 1998
Sold by
Osier Gary B and Osier Vicki L
Bought by
Westbrook Matt Thompson and Westbrook Elizabeth Gallerein
Home Financials for this Owner
Home Financials are based on the most recent Mortgage that was taken out on this home.
Original Mortgage
$129,000
Interest Rate
6.94%
Purchase Details
Closed on
May 18, 1994
Sold by
Daniels Keith and Daniels Sandra
Bought by
Osier Gary B and Osier Vicki L
Home Financials for this Owner
Home Financials are based on the most recent Mortgage that was taken out on this home.
Original Mortgage
$123,750
Interest Rate
8.19%
Create a Home Valuation Report for This Property
The Home Valuation Report is an in-depth analysis detailing your home's value as well as a comparison with similar homes in the area
Home Values in the Area
Average Home Value in this Area
Purchase History
| Date | Buyer | Sale Price | Title Company |
|---|---|---|---|
| Obrien Terrye Jo | -- | None Available | |
| Allen Lee Wayne | -- | None Available | |
| Westbrook Matt Thompson | -- | Commonwealth Land Title | |
| Osier Gary B | -- | Fidelity National Title Agen |
Source: Public Records
Mortgage History
| Date | Status | Borrower | Loan Amount |
|---|---|---|---|
| Previous Owner | Westbrook Matt Thompson | $129,000 | |
| Previous Owner | Osier Gary B | $123,750 |
Source: Public Records
Tax History Compared to Growth
Tax History
| Year | Tax Paid | Tax Assessment Tax Assessment Total Assessment is a certain percentage of the fair market value that is determined by local assessors to be the total taxable value of land and additions on the property. | Land | Improvement |
|---|---|---|---|---|
| 2025 | $1,948 | $583,929 | $247,500 | $336,429 |
| 2024 | $1,948 | $654,000 | $247,500 | $406,500 |
| 2023 | $8,573 | $675,000 | $247,500 | $427,500 |
| 2022 | $9,125 | $545,000 | $247,500 | $297,500 |
| 2021 | $9,223 | $420,000 | $148,500 | $271,500 |
| 2020 | $9,333 | $420,000 | $148,500 | $271,500 |
| 2019 | $9,710 | $420,000 | $148,500 | $271,500 |
| 2018 | $2,090 | $401,542 | $96,525 | $305,017 |
| 2017 | $5,220 | $309,765 | $96,525 | $213,240 |
| 2016 | $4,745 | $295,469 | $96,525 | $198,944 |
| 2015 | $4,034 | $182,600 | $50,000 | $132,600 |
| 2014 | $4,034 | $182,600 | $50,000 | $132,600 |
Source: Public Records
Map
Nearby Homes
- 4309 Meandering Way
- 4723 Bill Simmons Rd
- 4816 Bill Simmons Rd
- 2201 Oak Knoll Ct
- 4612 Bill Simmons Rd
- 1916 Renfro Rd
- 3216 Glade Rd
- 2904 Hickory Hill Ln
- 4106 Buckingham Place
- 2904 Hickory Hill St
- 2001 Oak Knoll Dr
- 4300 Eaton Cir
- 3900 Jackson Rd
- 1808 Arthur Dr
- 2204 Woodstock Dr
- 3909 Allendale St
- 2906 Edgewood Ln
- 3713 Teal Ln
- 3816 Rolling Meadows Dr
- 3813 Brookridge Ct
- 4600 Lakeside Dr
- 4513 Jim Mitchell Trail E
- 4605 Jim Mitchell Trail E
- 4600 Jim Mitchell Trail E
- 4604 Lakeside Dr
- 4516 Lakeside Dr
- 4608 Jim Mitchell Trail E
- 4516 Jim Mitchell Trail E
- 4608 Lakeside Dr
- 4601 Jim Mitchell Trail W
- 4512 Lakeside Dr
- 4509 Jim Mitchell Trail E
- 4613 Jim Mitchell Trail E
- 4609 Jim Mitchell Trail W
- 4612 Lakeside Dr
- 4517 Jim Mitchell Trail W
- 4508 Jim Mitchell Trail E
- 4616 Jim Mitchell Trail E
- 4603 Lakeside Dr
- 4508 Lakeside Dr