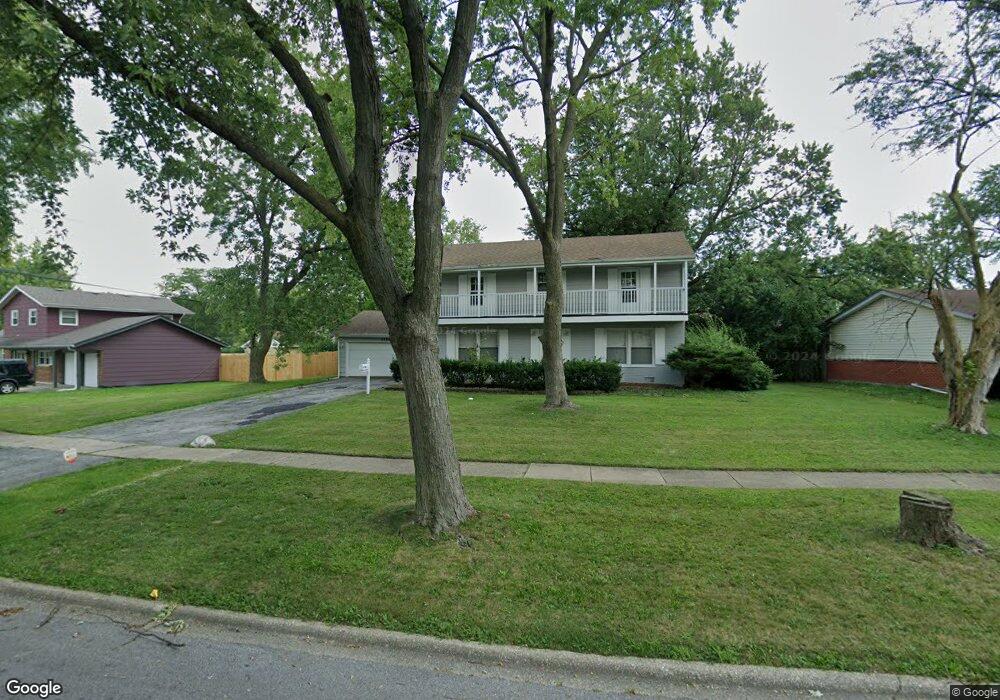
4609 176th Place Country Club Hills, IL 60478
Estimated Value: $243,000 - $295,000
4
Beds
3
Baths
2,576
Sq Ft
$104/Sq Ft
Est. Value
About This Home
This home is located at 4609 176th Place, Country Club Hills, IL 60478 and is currently estimated at $267,578, approximately $103 per square foot. 4609 176th Place is a home located in Cook County with nearby schools including Zenon J Sykuta School, Meadowview Intermediate School, and Southwood Middle School.
Ownership History
Date
Name
Owned For
Owner Type
Purchase Details
Closed on
Dec 6, 2017
Sold by
Jca Fund 11 Llc Series 4609
Bought by
Gca Investments Llc
Current Estimated Value
Purchase Details
Closed on
Oct 9, 2015
Sold by
Roa Robert
Bought by
Ja Capital Management Llc
Purchase Details
Closed on
Oct 17, 2003
Sold by
Molk Thomas
Bought by
Roa Roberto
Home Financials for this Owner
Home Financials are based on the most recent Mortgage that was taken out on this home.
Original Mortgage
$151,905
Interest Rate
6.01%
Mortgage Type
Purchase Money Mortgage
Purchase Details
Closed on
Dec 12, 2002
Sold by
Wells Fargo Bank Minnesota
Bought by
Molk Thomas
Purchase Details
Closed on
Aug 6, 2001
Sold by
Benson Nathaniel
Bought by
Wells Fargo Bank Minnesota and Option One Mtg Loan Trust 1999-C
Create a Home Valuation Report for This Property
The Home Valuation Report is an in-depth analysis detailing your home's value as well as a comparison with similar homes in the area
Home Values in the Area
Average Home Value in this Area
Purchase History
| Date | Buyer | Sale Price | Title Company |
|---|---|---|---|
| Gca Investments Llc | -- | None Available | |
| Ja Capital Management Llc | $24,500 | None Available | |
| Roa Roberto | $160,000 | Atgf Inc | |
| Molk Thomas | -- | -- | |
| Wells Fargo Bank Minnesota | -- | -- |
Source: Public Records
Mortgage History
| Date | Status | Borrower | Loan Amount |
|---|---|---|---|
| Previous Owner | Roa Roberto | $151,905 |
Source: Public Records
Tax History Compared to Growth
Tax History
| Year | Tax Paid | Tax Assessment Tax Assessment Total Assessment is a certain percentage of the fair market value that is determined by local assessors to be the total taxable value of land and additions on the property. | Land | Improvement |
|---|---|---|---|---|
| 2024 | $9,961 | $20,001 | $3,847 | $16,154 |
| 2023 | $9,538 | $20,001 | $3,847 | $16,154 |
| 2022 | $9,538 | $13,550 | $3,297 | $10,253 |
| 2021 | $9,611 | $13,550 | $3,297 | $10,253 |
| 2020 | $9,771 | $13,550 | $3,297 | $10,253 |
| 2019 | $8,199 | $11,111 | $3,022 | $8,089 |
| 2018 | $5,414 | $11,111 | $3,022 | $8,089 |
| 2017 | $7,182 | $13,741 | $3,022 | $10,719 |
| 2016 | $5,284 | $10,295 | $2,747 | $7,548 |
| 2015 | $6,418 | $12,366 | $2,747 | $9,619 |
| 2014 | $6,340 | $12,366 | $2,747 | $9,619 |
| 2013 | $5,741 | $12,462 | $2,747 | $9,715 |
Source: Public Records
Map
Nearby Homes
- 4656 176th Place
- 4411 177th Place
- 4847 175th St
- 17940 Michael Ave
- 4421 179th St
- 4240 176th St
- 4207 176th Place
- 4200 W 176th Place
- 5013 180th St
- 4101 176th Place
- 18038 Juneway Ct
- 4061 177th St
- 4101 Park Ln Unit 1
- 18057 Juneway Ct
- 4826 Summerhill Dr
- 17942 Edwards Ave
- 17700 Oakwood Ave
- 18109 Idlewild Dr
- 18115 Idlewild Dr
- 17963 Huntleigh Ct Unit 302
- 4617 176th Place
- 4601 176th Place
- 17632 Anthony Ave
- 4625 176th Place
- 4608 177th St
- 4608 176th Place
- 4600 176th Place
- 4624 176th Place
- 4616 177th St
- 4633 176th Place
- 4632 176th Place
- 4640 176th Place
- 17631 Anthony Ave
- 4641 176th Place
- 17625 Anthony Ave
- 17619 Anthony Ave
- 4601 177th St
- 4609 176th St
- 4633 176th St