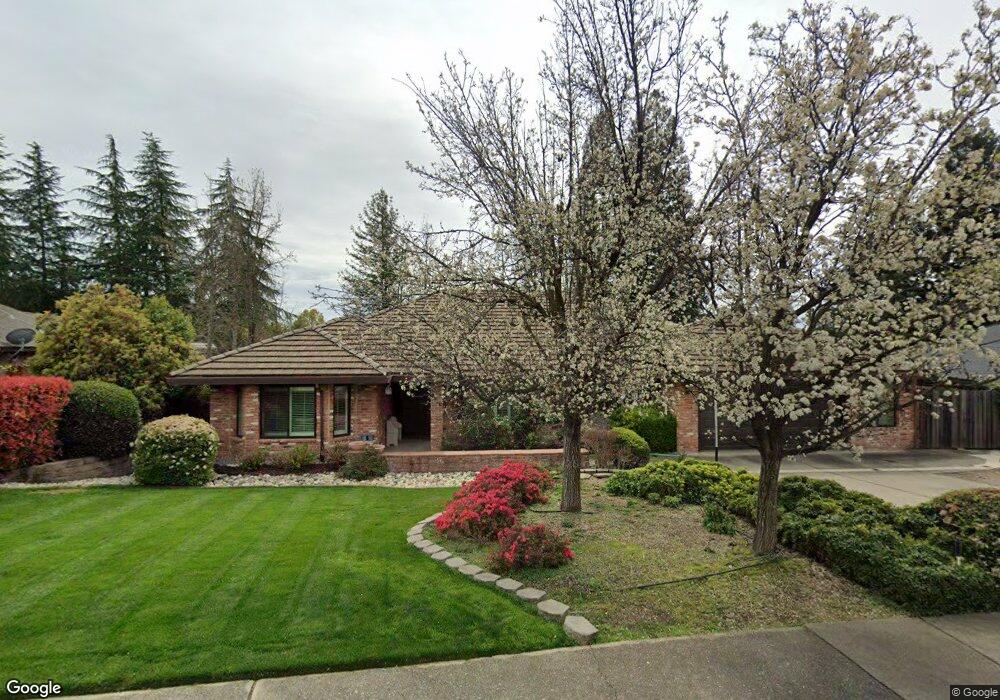
4610 Lemonhill Dr Rocklin, CA 95677
Mission Hills NeighborhoodEstimated Value: $622,000 - $877,000
4
Beds
3
Baths
2,661
Sq Ft
$291/Sq Ft
Est. Value
About This Home
This home is located at 4610 Lemonhill Dr, Rocklin, CA 95677 and is currently estimated at $774,158, approximately $290 per square foot. 4610 Lemonhill Dr is a home located in Placer County with nearby schools including Parker Whitney Elementary School, Spring View Middle School, and Rocklin High.
Ownership History
Date
Name
Owned For
Owner Type
Purchase Details
Closed on
Dec 24, 2007
Sold by
Batsford Bernard F and Batsford Ruth E
Bought by
Batsford Bernard F and Batsford Ruth E
Current Estimated Value
Purchase Details
Closed on
Sep 18, 2002
Sold by
Batsford Bernard F and Batsford Ruth E
Bought by
Batsford Bernard F and Batsford Ruth E
Home Financials for this Owner
Home Financials are based on the most recent Mortgage that was taken out on this home.
Original Mortgage
$182,000
Outstanding Balance
$76,028
Interest Rate
6.24%
Estimated Equity
$698,130
Purchase Details
Closed on
Apr 1, 1999
Sold by
Batsford Bernard F & Ruth E Trs
Bought by
Batsford Bernard F and Batsford Ruth E
Home Financials for this Owner
Home Financials are based on the most recent Mortgage that was taken out on this home.
Original Mortgage
$121,500
Interest Rate
7.04%
Purchase Details
Closed on
Aug 29, 1996
Sold by
Batsford Bernard F and Batsford Ruth E
Bought by
Batsford Bernard F and Batsford Ruth E
Create a Home Valuation Report for This Property
The Home Valuation Report is an in-depth analysis detailing your home's value as well as a comparison with similar homes in the area
Home Values in the Area
Average Home Value in this Area
Purchase History
| Date | Buyer | Sale Price | Title Company |
|---|---|---|---|
| Batsford Bernard F | -- | None Available | |
| Batsford Bernard F | -- | Fidelity Natl Title Co Of Ca | |
| Batsford Bernard F | -- | Financial Title Company | |
| Batsford Bernard F | -- | Financial Title Company | |
| Batsford Bernard F | -- | -- | |
| Batsford Bernard F | -- | -- |
Source: Public Records
Mortgage History
| Date | Status | Borrower | Loan Amount |
|---|---|---|---|
| Open | Batsford Bernard F | $182,000 | |
| Closed | Batsford Bernard F | $121,500 |
Source: Public Records
Tax History Compared to Growth
Tax History
| Year | Tax Paid | Tax Assessment Tax Assessment Total Assessment is a certain percentage of the fair market value that is determined by local assessors to be the total taxable value of land and additions on the property. | Land | Improvement |
|---|---|---|---|---|
| 2025 | $3,778 | $350,960 | $80,373 | $270,587 |
| 2023 | $3,778 | $337,334 | $77,253 | $260,081 |
| 2022 | $3,654 | $330,721 | $75,739 | $254,982 |
| 2021 | $3,614 | $324,237 | $74,254 | $249,983 |
| 2020 | $3,608 | $320,913 | $73,493 | $247,420 |
| 2019 | $3,557 | $314,621 | $72,052 | $242,569 |
| 2018 | $3,465 | $308,453 | $70,640 | $237,813 |
| 2017 | $3,467 | $302,405 | $69,255 | $233,150 |
| 2016 | $3,368 | $296,477 | $67,898 | $228,579 |
| 2015 | $3,325 | $292,025 | $66,879 | $225,146 |
| 2014 | $3,265 | $286,305 | $65,569 | $220,736 |
Source: Public Records
Map
Nearby Homes
- 3993 Aitken Dairy Rd
- 4245 Americana Way
- 4346 Lakebreeze Dr
- 0 Skyline Dr Unit 225004715
- 3804 Fenway Cir
- 3724 Sweetwater Dr
- 4050 Whitney Vista Ln
- 4057 Whitney Vista Ln
- 4250 Circuit Dr
- 3425 Cimmeron Ct
- 4072 Whitney Vista Ln
- 3415 Oakcreek Dr
- 3563 Creekwood Dr
- 4695 Pacific St Unit 10
- 3420 Nathan Ct
- 3962 Rawhide Rd
- 3510 Cheri Ct
- 4920 Pacific St
- 3710 Clover Valley Rd
- 4209 Silver Spur Ct
- 4608 Lemonhill Dr
- 4612 Lemonhill Dr
- 4611 Chelsea Place
- 4609 Chelsea Place
- 4607 Chelsea Place
- 4606 Lemonhill Dr
- 4609 Lemonhill Dr
- 4615 Chelsea Place
- 4611 Lemonhill Dr
- 4605 Chelsea Place
- 4607 Lemonhill Dr
- 4603 Chelsea Place
- 3946 Sweetwater Dr
- 3900 Chelsea Ct
- 4605 Lemonhill Dr
- 4614 Chelsea Place
- 4004 Sweetwater Ct
- 4002 Sweetwater Ct
- 4610 Chelsea Place
- 3944 Sweetwater Dr