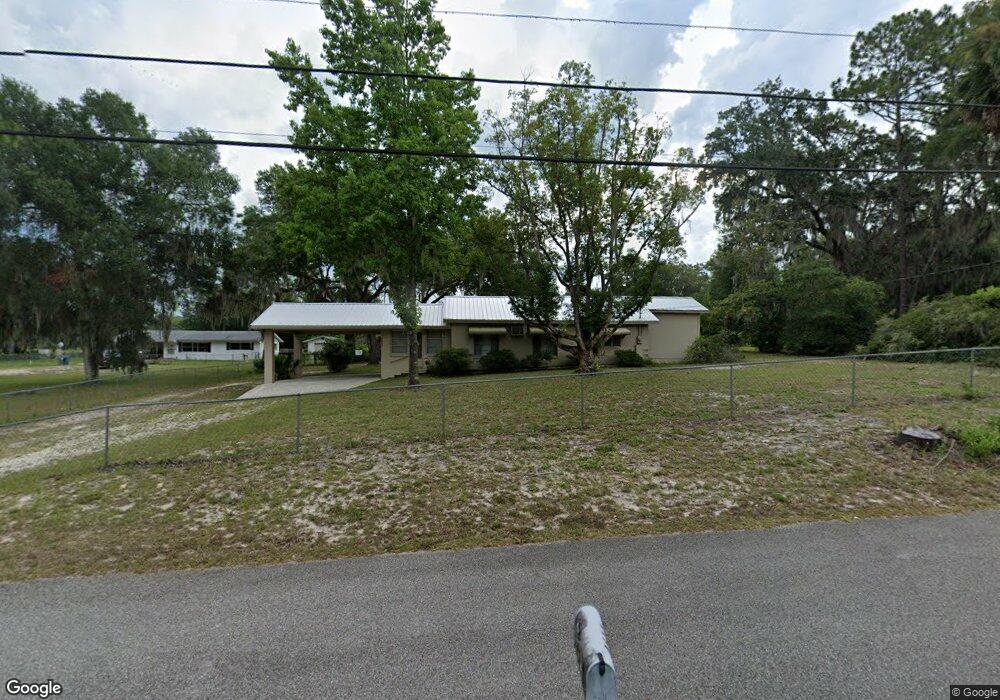
4611 Grand Ave de Leon Springs, FL 32130
North DeLand NeighborhoodEstimated Value: $226,000 - $251,542
2
Beds
1
Bath
1,088
Sq Ft
$217/Sq Ft
Est. Value
About This Home
This home is located at 4611 Grand Ave, de Leon Springs, FL 32130 and is currently estimated at $236,636, approximately $217 per square foot. 4611 Grand Ave is a home located in Volusia County with nearby schools including Louise S. McInnis Elementary School and T. Dewitt Taylor Middle/High School.
Ownership History
Date
Name
Owned For
Owner Type
Purchase Details
Closed on
Mar 1, 2018
Sold by
Shaffer William Theodore
Bought by
Armstrong Todd and Armstrong Patricia
Current Estimated Value
Purchase Details
Closed on
Feb 11, 2011
Sold by
Mair Stephen A
Bought by
Armstrong Todd M and Armstrong Patricia A
Purchase Details
Closed on
Dec 21, 2007
Sold by
Mair Stephen A and Armstrong Todd M
Bought by
Mair Stephen A and Armstrong Todd M
Purchase Details
Closed on
Mar 5, 2007
Sold by
Herndon Norma Faye and Bembry Larry C
Bought by
Mair Stephen A and Armstrong Todd M
Purchase Details
Closed on
Feb 21, 2007
Sold by
Brannen Winton T
Bought by
Herndon Norma Faye and Bembry Larry C
Purchase Details
Closed on
Oct 4, 2002
Sold by
Bembry Aaron C and Bembry Ann S
Bought by
Bembry Aaron C and Bembry Ann S
Purchase Details
Closed on
Dec 22, 1998
Sold by
Brannen Winton T and Brannen Jeannine B
Bought by
Bembry Aaron C and Bembry Ann S
Purchase Details
Closed on
Jul 15, 1984
Bought by
Armstrong Todd M and Armstrong Patricia A
Create a Home Valuation Report for This Property
The Home Valuation Report is an in-depth analysis detailing your home's value as well as a comparison with similar homes in the area
Home Values in the Area
Average Home Value in this Area
Purchase History
| Date | Buyer | Sale Price | Title Company |
|---|---|---|---|
| Armstrong Todd | -- | Attorney | |
| Armstrong Todd M | -- | Attorney | |
| Mair Stephen A | -- | Attorney | |
| Mair Stephen A | $160,900 | Ability Title Inc | |
| Herndon Norma Faye | -- | Ability Title Inc | |
| Bembry Aaron C | -- | -- | |
| Bembry Aaron C | $65,000 | -- | |
| Armstrong Todd M | $100 | -- |
Source: Public Records
Tax History Compared to Growth
Tax History
| Year | Tax Paid | Tax Assessment Tax Assessment Total Assessment is a certain percentage of the fair market value that is determined by local assessors to be the total taxable value of land and additions on the property. | Land | Improvement |
|---|---|---|---|---|
| 2025 | $3,559 | $198,271 | $41,452 | $156,819 |
| 2024 | $3,559 | $201,987 | $41,452 | $160,535 |
| 2023 | $3,559 | $192,893 | $38,343 | $154,550 |
| 2022 | $2,784 | $167,703 | $38,343 | $129,360 |
| 2021 | $2,687 | $119,366 | $29,275 | $90,091 |
| 2020 | $2,475 | $108,650 | $23,835 | $84,815 |
| 2019 | $2,508 | $110,080 | $23,576 | $86,504 |
| 2018 | $2,334 | $97,869 | $18,490 | $79,379 |
| 2017 | $2,193 | $90,849 | $17,568 | $73,281 |
| 2016 | $1,976 | $83,499 | $0 | $0 |
| 2015 | $1,922 | $83,412 | $0 | $0 |
| 2014 | $1,738 | $71,464 | $0 | $0 |
Source: Public Records
Map
Nearby Homes
- 1955 Hillcrest Oak Dr
- 0 North St
- 0 No Name Parcel 05163011380050 Unit V4910400
- 0 Pid# 44 16 29 01 00 1141 Unit MFRV4944345
- 1909 S Farm Rd
- 2053 Bond Rd
- 5060 Audubon Ave
- 0 E Berlin St
- 1806 Glenwood Oaks Ln
- 290 E Baxter St
- 2015 Hawk Haven Trail
- 237 Cortez Ave
- 0 Philadelphia Ave
- 329 Desoto Ave
- 4155 N Us Hwy 17
- 0 Garden St Unit MFRO6109460
- 235 Garden St
- 3660 Grand Ave
- 30 High Ridge Ave
- 226 Garden St