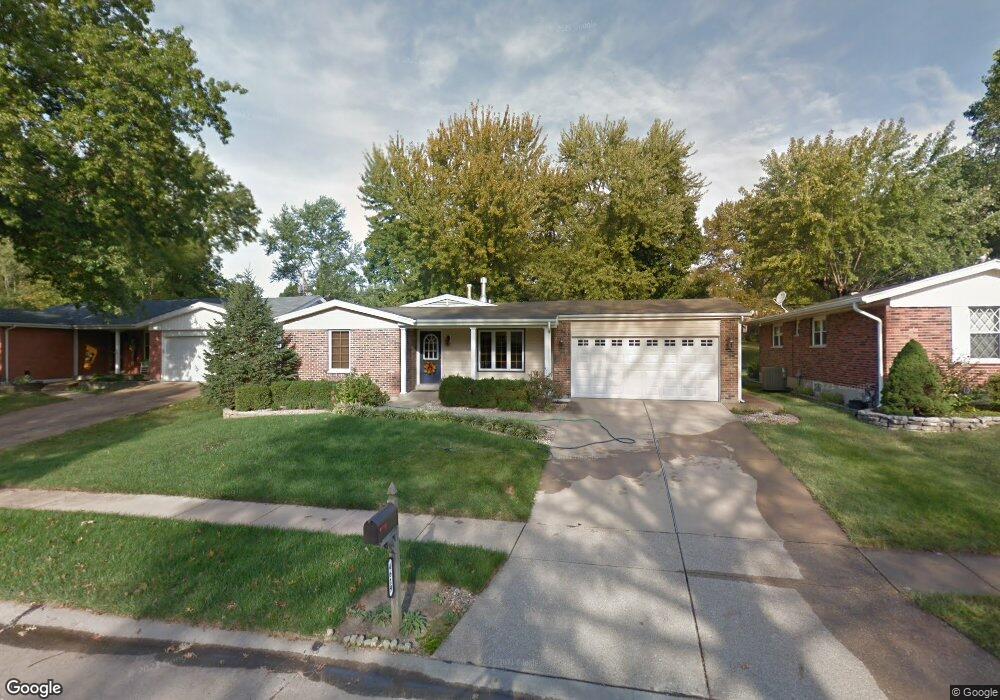
4619 Towne South Rd Saint Louis, MO 63128
Estimated Value: $330,000 - $374,000
3
Beds
2
Baths
1,406
Sq Ft
$244/Sq Ft
Est. Value
About This Home
This home is located at 4619 Towne South Rd, Saint Louis, MO 63128 and is currently estimated at $343,335, approximately $244 per square foot. 4619 Towne South Rd is a home located in St. Louis County with nearby schools including Kennerly Elementary School, Sperreng Middle School, and Lindbergh High School.
Ownership History
Date
Name
Owned For
Owner Type
Purchase Details
Closed on
Jun 11, 2015
Sold by
Blume Ii Richard and Blume Sheila
Bought by
Blume Ii Richard A and Blume Sheila M
Current Estimated Value
Home Financials for this Owner
Home Financials are based on the most recent Mortgage that was taken out on this home.
Original Mortgage
$164,000
Outstanding Balance
$95,440
Interest Rate
3.82%
Mortgage Type
New Conventional
Estimated Equity
$247,895
Purchase Details
Closed on
Sep 23, 2004
Sold by
John J & Martha S Dueker Living Trust
Bought by
Blume Ii Richard and Blume Sheila
Home Financials for this Owner
Home Financials are based on the most recent Mortgage that was taken out on this home.
Original Mortgage
$100,000
Interest Rate
5.74%
Mortgage Type
Seller Take Back
Purchase Details
Closed on
Apr 22, 1997
Sold by
Dueker John J and Dueker Martha S
Bought by
Dueker John J and Dueker Martha S
Purchase Details
Closed on
Jan 7, 1997
Sold by
Dueker Bernard H
Bought by
Dueker John J and Dueker Martha S
Create a Home Valuation Report for This Property
The Home Valuation Report is an in-depth analysis detailing your home's value as well as a comparison with similar homes in the area
Home Values in the Area
Average Home Value in this Area
Purchase History
| Date | Buyer | Sale Price | Title Company |
|---|---|---|---|
| Blume Ii Richard A | -- | Investors Title Co Clayton | |
| Blume Ii Richard | $115,000 | -- | |
| Dueker John J | -- | -- | |
| Dueker John J | -- | -- |
Source: Public Records
Mortgage History
| Date | Status | Borrower | Loan Amount |
|---|---|---|---|
| Open | Blume Ii Richard A | $164,000 | |
| Closed | Blume Ii Richard | $100,000 |
Source: Public Records
Tax History Compared to Growth
Tax History
| Year | Tax Paid | Tax Assessment Tax Assessment Total Assessment is a certain percentage of the fair market value that is determined by local assessors to be the total taxable value of land and additions on the property. | Land | Improvement |
|---|---|---|---|---|
| 2025 | $3,502 | $55,110 | $14,350 | $40,760 |
| 2024 | $3,502 | $53,790 | $14,350 | $39,440 |
| 2023 | $3,494 | $53,790 | $14,350 | $39,440 |
| 2022 | $3,090 | $45,610 | $14,350 | $31,260 |
| 2021 | $2,980 | $45,610 | $14,350 | $31,260 |
| 2020 | $2,591 | $38,210 | $14,350 | $23,860 |
| 2019 | $2,585 | $38,210 | $14,350 | $23,860 |
| 2018 | $2,622 | $35,270 | $8,760 | $26,510 |
| 2017 | $2,594 | $35,270 | $8,760 | $26,510 |
| 2016 | $2,289 | $29,510 | $7,980 | $21,530 |
| 2015 | $2,254 | $29,510 | $7,980 | $21,530 |
| 2014 | -- | $31,490 | $5,950 | $25,540 |
Source: Public Records
Map
Nearby Homes
- 4645 Tauneybrook Dr
- 4643 Littlebury Dr
- 4818 Chapel Hill Dr
- 4449 Pinyon Jay Ct
- 4829 Vermilion Dr
- 4839 Hursley Dr
- 4833 Hursley Dr
- 4801 Langtree Dr
- 4931 Theiss Rd
- 12055 Charwick Dr
- 4838 Dorsie Dr
- 5135 Towne Centre Dr
- 4942 Caribee Dr
- 12015 Charwick Dr
- 5100 Melitta Dr
- 4700 Theiss Rd
- 4849 Gatesbury Dr
- 4642 Theiss Rd
- 11862 E Concord Rd
- 5057 Peyton Place Ct
- 4615 Towne South Rd
- 4623 Towne South Rd
- 4623 Towne Rd S
- 4609 Towne South Rd
- 4627 Towne South Rd
- 4620 Towne South Rd
- 4616 Towne South Rd
- 4620 Towne Rd S
- 4616 Towne Rd S
- 4914 Milsmar Dr
- 4626 Towne Rd S
- 4910 Milsmar Dr
- 4626 Towne South Rd
- 4612 Towne South Rd
- 4920 Milsmar Dr
- 4630 Towne South Rd
- 4606 Towne South Rd
- 4622 Dorbendale Ct
- 4628 Dorbendale Ct
- 4614 Dorbendale Ct