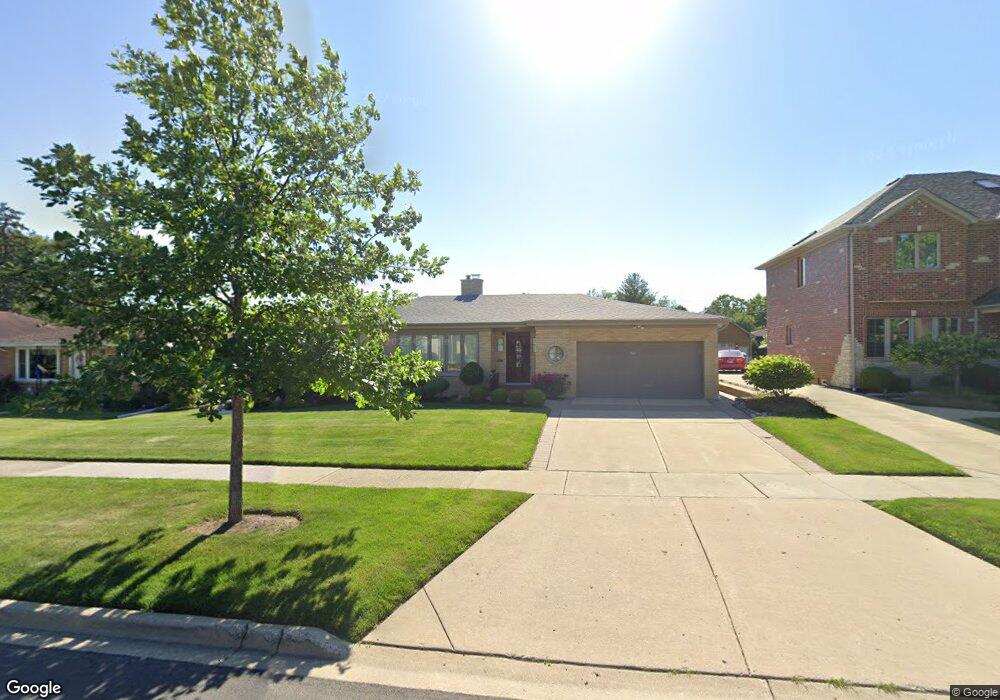
462 N Larch Ave Elmhurst, IL 60126
Estimated Value: $447,000 - $569,000
3
Beds
2
Baths
1,357
Sq Ft
$368/Sq Ft
Est. Value
About This Home
This home is located at 462 N Larch Ave, Elmhurst, IL 60126 and is currently estimated at $499,281, approximately $367 per square foot. 462 N Larch Ave is a home located in DuPage County with nearby schools including Emerson Elementary School, Churchville Middle School, and York Community High School.
Ownership History
Date
Name
Owned For
Owner Type
Purchase Details
Closed on
Nov 3, 2014
Sold by
Nardulli Domenico and Nardulli Pasqua
Bought by
Domenico & Pasqua Nardulli Family Trust
Current Estimated Value
Purchase Details
Closed on
Apr 13, 2006
Sold by
Viripiparambil Thomas and Thomas Molly
Bought by
Nardulli Domenico and Nardulli Pasquea
Home Financials for this Owner
Home Financials are based on the most recent Mortgage that was taken out on this home.
Original Mortgage
$312,000
Outstanding Balance
$180,535
Interest Rate
6.48%
Mortgage Type
Fannie Mae Freddie Mac
Estimated Equity
$318,746
Purchase Details
Closed on
Jul 31, 2003
Sold by
Antich John J and Antich Rose C
Bought by
Viripiparambil Thomas and Thomas Molly
Home Financials for this Owner
Home Financials are based on the most recent Mortgage that was taken out on this home.
Original Mortgage
$282,000
Interest Rate
6.04%
Mortgage Type
Purchase Money Mortgage
Create a Home Valuation Report for This Property
The Home Valuation Report is an in-depth analysis detailing your home's value as well as a comparison with similar homes in the area
Home Values in the Area
Average Home Value in this Area
Purchase History
| Date | Buyer | Sale Price | Title Company |
|---|---|---|---|
| Domenico & Pasqua Nardulli Family Trust | -- | None Available | |
| Nardulli Domenico | $390,000 | Rtc | |
| Viripiparambil Thomas | $297,000 | Cti |
Source: Public Records
Mortgage History
| Date | Status | Borrower | Loan Amount |
|---|---|---|---|
| Open | Nardulli Domenico | $312,000 | |
| Previous Owner | Viripiparambil Thomas | $282,000 |
Source: Public Records
Tax History Compared to Growth
Tax History
| Year | Tax Paid | Tax Assessment Tax Assessment Total Assessment is a certain percentage of the fair market value that is determined by local assessors to be the total taxable value of land and additions on the property. | Land | Improvement |
|---|---|---|---|---|
| 2024 | $8,663 | $149,453 | $74,362 | $75,091 |
| 2023 | $7,986 | $137,390 | $68,360 | $69,030 |
| 2022 | $7,689 | $131,530 | $65,410 | $66,120 |
| 2021 | $7,359 | $125,980 | $62,650 | $63,330 |
| 2020 | $6,922 | $120,670 | $60,010 | $60,660 |
| 2019 | $6,850 | $116,030 | $57,700 | $58,330 |
| 2018 | $6,407 | $108,300 | $54,960 | $53,340 |
| 2017 | $6,280 | $103,510 | $52,530 | $50,980 |
| 2016 | $6,012 | $95,570 | $48,500 | $47,070 |
| 2015 | $5,888 | $88,280 | $44,800 | $43,480 |
| 2014 | $5,224 | $73,100 | $36,960 | $36,140 |
| 2013 | $5,205 | $74,590 | $37,710 | $36,880 |
Source: Public Records
Map
Nearby Homes
- 456 N Elm Ave
- 251 W Armitage Ave
- 634 N Kenilworth Ave
- 183 E Grantley Ave
- 262 N Addison Ave
- 260 N Addison Ave
- 258 N Addison Ave
- 254 N Addison Ave
- 442 N Oak St
- 234 E Grantley Ave
- 286 N Indiana St
- 468 N Highland Ave
- 412 N Ridgeland Ave
- 260 E Grantley Ave
- 210 N Addison Ave Unit 202
- 195 N Addison Ave Unit PH03
- 193 N Elm Ave
- 322 N Highland Ave
- 564 N Adele St
- 407 W North Ave
- 466 N Larch Ave
- 456 N Larch Ave
- 470 N Larch Ave
- 452 N Larch Ave
- 472 N Larch Ave
- 455 N Larch Ave
- 448 N Larch Ave
- 463 N Larch Ave
- 471 N Larch Ave
- 459 N Larch Ave
- 463 N Maple Ave
- 451 N Maple Ave
- 475 N Larch Ave
- 449 N Larch Ave
- 170 W Armitage Ave
- 176 W Armitage Ave
- 459 N Maple Ave
- 444 N Larch Ave
- 473 N Maple Ave
- 447 N Maple Ave