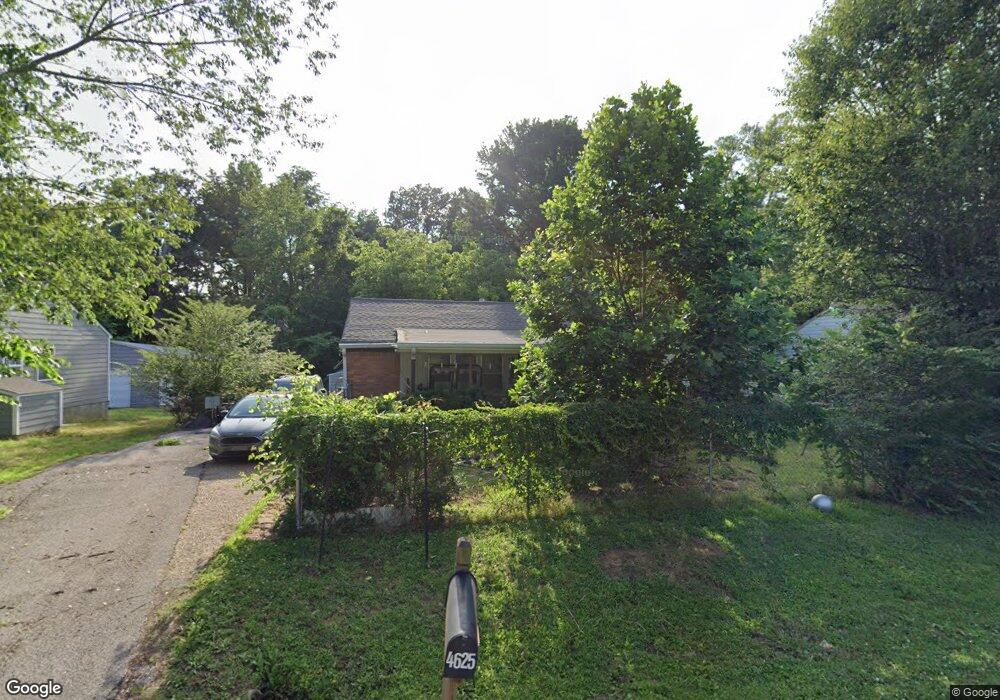
4625 Percy Rd Memphis, TN 38109
Whitehaven NeighborhoodEstimated Value: $76,415 - $123,000
3
Beds
1
Bath
1,448
Sq Ft
$63/Sq Ft
Est. Value
About This Home
This home is located at 4625 Percy Rd, Memphis, TN 38109 and is currently estimated at $91,854, approximately $63 per square foot. 4625 Percy Rd is a home located in Shelby County with nearby schools including Geeter School, Freedom Preparatory Academy Charter Elementary School - Westwood Campus, and Freedom Preparatory Academy Westwood Elementary at Parkrose.
Ownership History
Date
Name
Owned For
Owner Type
Purchase Details
Closed on
Oct 3, 2023
Sold by
Pickering Michael Donnell
Bought by
Pickering Mary
Current Estimated Value
Purchase Details
Closed on
Jun 30, 2008
Sold by
Schwindt Edna Laverne Chalk
Bought by
Pickering Mary and Pickering Michael Donnell
Home Financials for this Owner
Home Financials are based on the most recent Mortgage that was taken out on this home.
Original Mortgage
$63,995
Interest Rate
6.08%
Mortgage Type
FHA
Create a Home Valuation Report for This Property
The Home Valuation Report is an in-depth analysis detailing your home's value as well as a comparison with similar homes in the area
Home Values in the Area
Average Home Value in this Area
Purchase History
| Date | Buyer | Sale Price | Title Company |
|---|---|---|---|
| Pickering Mary | -- | None Listed On Document | |
| Pickering Mary | $65,000 | None Available |
Source: Public Records
Mortgage History
| Date | Status | Borrower | Loan Amount |
|---|---|---|---|
| Previous Owner | Pickering Mary | $63,995 |
Source: Public Records
Tax History Compared to Growth
Tax History
| Year | Tax Paid | Tax Assessment Tax Assessment Total Assessment is a certain percentage of the fair market value that is determined by local assessors to be the total taxable value of land and additions on the property. | Land | Improvement |
|---|---|---|---|---|
| 2025 | $330 | $13,925 | $2,050 | $11,875 |
| 2024 | $330 | $9,725 | $1,600 | $8,125 |
| 2023 | $592 | $9,725 | $1,600 | $8,125 |
| 2022 | $592 | $9,725 | $1,600 | $8,125 |
| 2021 | $599 | $9,725 | $1,600 | $8,125 |
| 2020 | $674 | $9,300 | $1,600 | $7,700 |
| 2019 | $674 | $9,300 | $1,600 | $7,700 |
| 2018 | $674 | $9,300 | $1,600 | $7,700 |
| 2017 | $382 | $9,300 | $1,600 | $7,700 |
| 2016 | $417 | $9,550 | $0 | $0 |
| 2014 | $417 | $9,550 | $0 | $0 |
Source: Public Records
Map
Nearby Homes