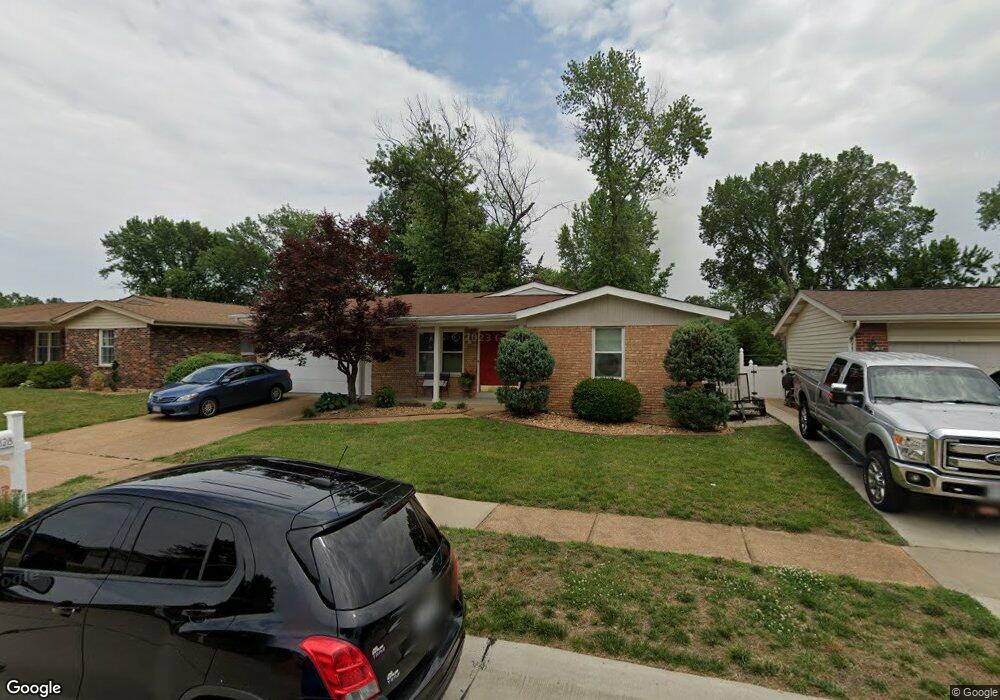
4628 Dorbendale Ct Saint Louis, MO 63128
Estimated Value: $336,000 - $364,000
3
Beds
2
Baths
1,410
Sq Ft
$246/Sq Ft
Est. Value
About This Home
This home is located at 4628 Dorbendale Ct, Saint Louis, MO 63128 and is currently estimated at $346,928, approximately $246 per square foot. 4628 Dorbendale Ct is a home located in St. Louis County with nearby schools including Kennerly Elementary School, Sperreng Middle School, and Lindbergh High School.
Ownership History
Date
Name
Owned For
Owner Type
Purchase Details
Closed on
Nov 20, 2024
Sold by
Tribley Lisa K and Johnson James Russell
Bought by
Johnson James Russell and Johnson Lisa Kay
Current Estimated Value
Home Financials for this Owner
Home Financials are based on the most recent Mortgage that was taken out on this home.
Original Mortgage
$20,000
Outstanding Balance
$19,296
Interest Rate
5.99%
Mortgage Type
Credit Line Revolving
Estimated Equity
$327,632
Purchase Details
Closed on
Apr 12, 2013
Sold by
Preston Johnny E and Preston Judith
Bought by
Tribley Lisa K
Home Financials for this Owner
Home Financials are based on the most recent Mortgage that was taken out on this home.
Original Mortgage
$170,356
Interest Rate
3.25%
Mortgage Type
FHA
Purchase Details
Closed on
Mar 5, 2004
Sold by
Falast Robert E and Falast Judy
Bought by
Preston Johnny E and Preston Judith
Home Financials for this Owner
Home Financials are based on the most recent Mortgage that was taken out on this home.
Original Mortgage
$162,943
Interest Rate
5.68%
Mortgage Type
FHA
Create a Home Valuation Report for This Property
The Home Valuation Report is an in-depth analysis detailing your home's value as well as a comparison with similar homes in the area
Home Values in the Area
Average Home Value in this Area
Purchase History
| Date | Buyer | Sale Price | Title Company |
|---|---|---|---|
| Johnson James Russell | -- | Clear Title Group | |
| Johnson James Russell | -- | Clear Title Group | |
| Tribley Lisa K | $173,500 | Integrity Land Title Co Inc | |
| Preston Johnny E | $165,500 | -- |
Source: Public Records
Mortgage History
| Date | Status | Borrower | Loan Amount |
|---|---|---|---|
| Open | Johnson James Russell | $20,000 | |
| Closed | Johnson James Russell | $20,000 | |
| Previous Owner | Tribley Lisa K | $170,356 | |
| Previous Owner | Preston Johnny E | $162,943 |
Source: Public Records
Tax History Compared to Growth
Tax History
| Year | Tax Paid | Tax Assessment Tax Assessment Total Assessment is a certain percentage of the fair market value that is determined by local assessors to be the total taxable value of land and additions on the property. | Land | Improvement |
|---|---|---|---|---|
| 2025 | $3,646 | $57,520 | $14,350 | $43,170 |
| 2024 | $3,646 | $56,020 | $14,350 | $41,670 |
| 2023 | $3,646 | $56,020 | $14,350 | $41,670 |
| 2022 | $3,177 | $46,900 | $14,350 | $32,550 |
| 2021 | $3,064 | $46,900 | $14,350 | $32,550 |
| 2020 | $2,899 | $42,790 | $14,350 | $28,440 |
| 2019 | $2,891 | $42,790 | $14,350 | $28,440 |
| 2018 | $2,832 | $38,120 | $8,760 | $29,360 |
| 2017 | $2,801 | $38,120 | $8,760 | $29,360 |
| 2016 | $2,448 | $31,580 | $7,980 | $23,600 |
| 2015 | $2,410 | $31,580 | $7,980 | $23,600 |
| 2014 | $2,675 | $34,750 | $5,950 | $28,800 |
Source: Public Records
Map
Nearby Homes
- 4645 Tauneybrook Dr
- 4643 Littlebury Dr
- 4818 Chapel Hill Dr
- 4801 Langtree Dr
- 4449 Pinyon Jay Ct
- 4839 Hursley Dr
- 4833 Hursley Dr
- 4829 Vermilion Dr
- 4931 Theiss Rd
- 12055 Charwick Dr
- 5135 Towne Centre Dr
- 5100 Melitta Dr
- 12015 Charwick Dr
- 4838 Dorsie Dr
- 4942 Caribee Dr
- 10033 Carolynne Dr
- 11862 E Concord Rd
- 4849 Gatesbury Dr
- 10124 Carolynne Dr
- 4700 Theiss Rd
- 4634 Dorbendale Ct
- 4622 Dorbendale Ct
- 4614 Dorbendale Ct
- 4642 Dorbendale Ct
- 4631 Dorbendale Ct
- 4625 Dorbendale Ct
- 4648 Dorbendale Ct
- 4637 Dorbendale Ct
- 4617 Dorbendale Ct
- 4604 Dorbendale Ct
- 4924 Milsmar Dr
- 4649 Dorbendale Ct
- 4611 Dorbendale Ct
- 4920 Milsmar Dr
- 4623 Towne South Rd
- 4619 Towne South Rd
- 4623 Towne Rd S
- 4627 Towne South Rd
- 4615 Towne South Rd
- 4656 Dorbendale Ct