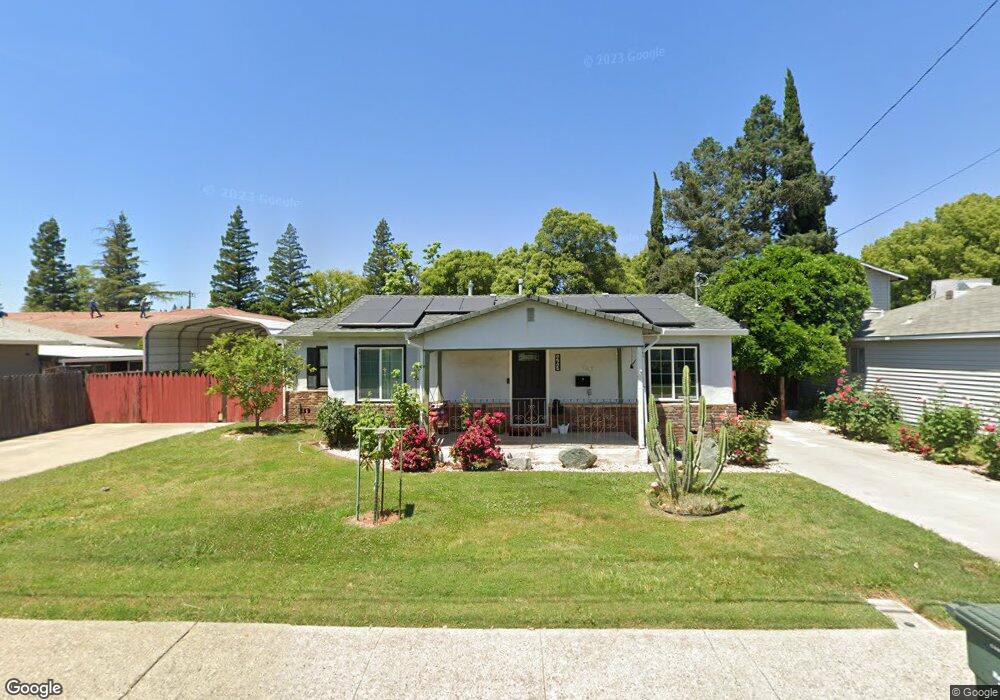
463 Ainsley Ave Yuba City, CA 95991
Estimated Value: $265,000 - $340,000
2
Beds
1
Bath
1,075
Sq Ft
$282/Sq Ft
Est. Value
About This Home
This home is located at 463 Ainsley Ave, Yuba City, CA 95991 and is currently estimated at $303,202, approximately $282 per square foot. 463 Ainsley Ave is a home located in Sutter County with nearby schools including King Avenue Elementary School, Gray Avenue Middle School, and River Valley High School.
Ownership History
Date
Name
Owned For
Owner Type
Purchase Details
Closed on
Apr 19, 2022
Sold by
Belmontes Manuel G and Belmontes Martha
Bought by
Belmontes Dolores Marie
Current Estimated Value
Home Financials for this Owner
Home Financials are based on the most recent Mortgage that was taken out on this home.
Original Mortgage
$145,500
Outstanding Balance
$136,082
Interest Rate
3.85%
Mortgage Type
New Conventional
Estimated Equity
$167,120
Purchase Details
Closed on
Dec 9, 2010
Sold by
Belmontes Manuel G and Belmontes Manuel
Bought by
Belmontes Manuel G and Belmontes Martha
Purchase Details
Closed on
May 25, 2010
Sold by
Belmontes Manuel
Bought by
Belmontes Manuel
Purchase Details
Closed on
Mar 27, 2009
Sold by
Eyles Harold L and Eyles Harold Lee
Bought by
Eyles Harold L
Create a Home Valuation Report for This Property
The Home Valuation Report is an in-depth analysis detailing your home's value as well as a comparison with similar homes in the area
Home Values in the Area
Average Home Value in this Area
Purchase History
| Date | Buyer | Sale Price | Title Company |
|---|---|---|---|
| Belmontes Dolores Marie | $150,000 | Old Republic Title | |
| Belmontes Manuel G | -- | None Available | |
| Belmontes Manuel | -- | None Available | |
| Eyles Harold L | -- | None Available |
Source: Public Records
Mortgage History
| Date | Status | Borrower | Loan Amount |
|---|---|---|---|
| Open | Belmontes Dolores Marie | $145,500 | |
| Closed | Belmontes Dolores Marie | $5,092 |
Source: Public Records
Tax History Compared to Growth
Tax History
| Year | Tax Paid | Tax Assessment Tax Assessment Total Assessment is a certain percentage of the fair market value that is determined by local assessors to be the total taxable value of land and additions on the property. | Land | Improvement |
|---|---|---|---|---|
| 2025 | $3,058 | $275,913 | $95,508 | $180,405 |
| 2024 | $3,058 | $270,504 | $93,636 | $176,868 |
| 2023 | $3,058 | $265,200 | $91,800 | $173,400 |
| 2022 | $1,552 | $133,790 | $30,403 | $103,387 |
| 2021 | $1,535 | $131,177 | $29,813 | $101,364 |
| 2020 | $1,508 | $129,832 | $29,507 | $100,325 |
| 2019 | $1,476 | $127,287 | $28,929 | $98,358 |
| 2018 | $1,454 | $124,791 | $28,362 | $96,429 |
| 2017 | $1,419 | $122,345 | $27,806 | $94,539 |
| 2016 | $1,391 | $119,945 | $27,260 | $92,685 |
| 2015 | $1,322 | $114,000 | $45,000 | $69,000 |
| 2014 | $1,310 | $112,000 | $35,000 | $77,000 |
Source: Public Records
Map
Nearby Homes
- 540 Carroll St
- 974 Live Oak Blvd
- 0 Market St
- 1194 Rosemary Ln
- 1410 Upland Dr
- 1440 Wendell Way
- 716 King Ave
- 726 Rosalind Ave
- 811 Francis Way
- 1307 Stafford Way
- 802 Olive St
- 814 Orange St
- 824 Rosalind Ave
- 1508 Upland Dr
- 536 Forbes Ave
- 372 Teegarden Ave
- 739 Olive St
- 733 Olive St
- 268 Teegarden Ave
- 785 Regent Loop