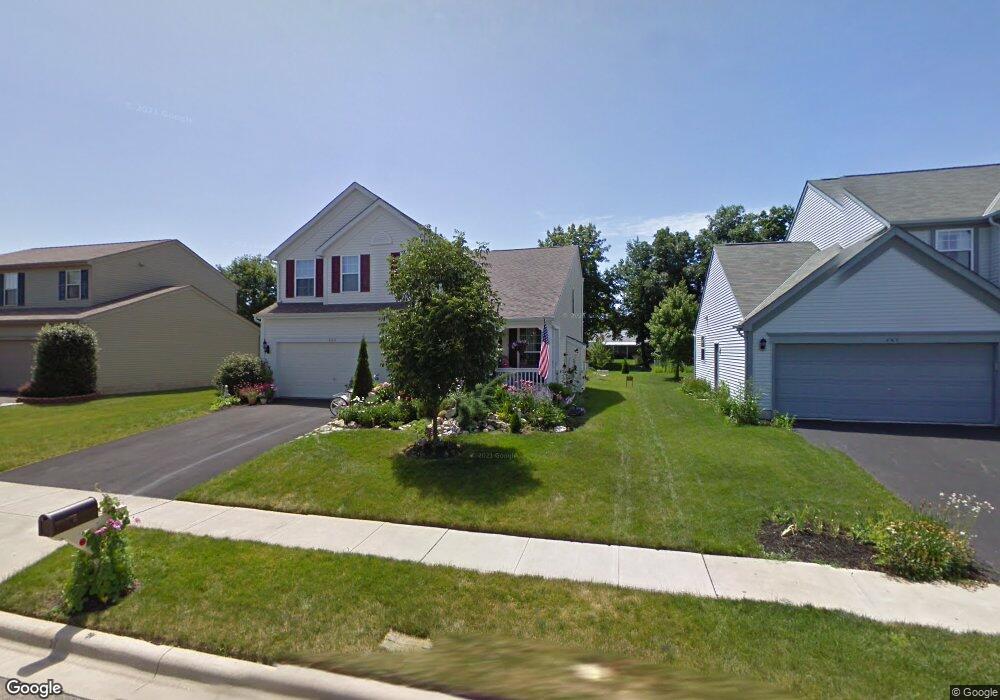
463 Tallman St Groveport, OH 43125
Estimated Value: $299,000 - $347,000
3
Beds
3
Baths
1,857
Sq Ft
$174/Sq Ft
Est. Value
About This Home
This home is located at 463 Tallman St, Groveport, OH 43125 and is currently estimated at $323,632, approximately $174 per square foot. 463 Tallman St is a home located in Franklin County with nearby schools including Groveport Madison High School, Groveport Community School, and Madison Christian School.
Ownership History
Date
Name
Owned For
Owner Type
Purchase Details
Closed on
Dec 17, 2003
Sold by
M/I Homes Of Central Ohio Llc
Bought by
Despas Nicholas T and Despas Sofiya
Current Estimated Value
Home Financials for this Owner
Home Financials are based on the most recent Mortgage that was taken out on this home.
Original Mortgage
$200,237
Outstanding Balance
$92,527
Interest Rate
5.84%
Mortgage Type
VA
Estimated Equity
$231,105
Create a Home Valuation Report for This Property
The Home Valuation Report is an in-depth analysis detailing your home's value as well as a comparison with similar homes in the area
Home Values in the Area
Average Home Value in this Area
Purchase History
| Date | Buyer | Sale Price | Title Company |
|---|---|---|---|
| Despas Nicholas T | $194,500 | Transohio Residential Title |
Source: Public Records
Mortgage History
| Date | Status | Borrower | Loan Amount |
|---|---|---|---|
| Open | Despas Nicholas T | $200,237 |
Source: Public Records
Tax History Compared to Growth
Tax History
| Year | Tax Paid | Tax Assessment Tax Assessment Total Assessment is a certain percentage of the fair market value that is determined by local assessors to be the total taxable value of land and additions on the property. | Land | Improvement |
|---|---|---|---|---|
| 2024 | $4,336 | $98,460 | $21,840 | $76,620 |
| 2023 | $4,328 | $98,455 | $21,840 | $76,615 |
| 2022 | $3,561 | $67,350 | $9,000 | $58,350 |
| 2021 | $3,574 | $67,350 | $9,000 | $58,350 |
| 2020 | $3,582 | $67,350 | $9,000 | $58,350 |
| 2019 | $3,245 | $55,550 | $7,490 | $48,060 |
| 2018 | $3,264 | $55,550 | $7,490 | $48,060 |
| 2017 | $3,253 | $55,550 | $7,490 | $48,060 |
| 2016 | $3,235 | $50,790 | $7,740 | $43,050 |
| 2015 | $3,264 | $50,790 | $7,740 | $43,050 |
| 2014 | $3,073 | $50,790 | $7,740 | $43,050 |
| 2013 | $1,394 | $53,480 | $8,155 | $45,325 |
Source: Public Records
Map
Nearby Homes
- 459 Tallman St
- 467 Tallman St
- 455 Tallman St
- 471 Tallman St
- 472 Benson Dr
- 466 Benson Dr
- 478 Benson Dr
- 462 Benson Dr
- 439 Greenhill Dr
- 451 Tallman St
- 475 Tallman St
- 484 Benson Dr
- 438 Greenhill Dr
- 436 Crestmoore Dr
- 443 Greenhill Dr
- 490 Benson Dr
- 447 Tallman St
- 479 Tallman St
- 450 Benson Dr
- 442 Greenhill Dr