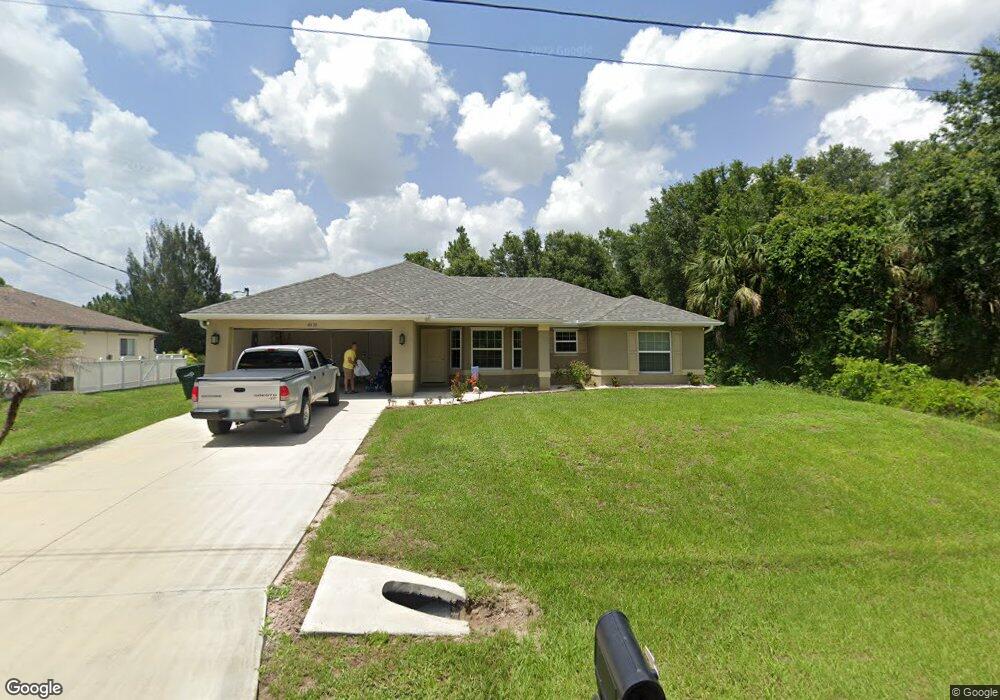
4638 Lenman Ave North Port, FL 34288
Estimated Value: $290,547 - $326,000
3
Beds
2
Baths
1,532
Sq Ft
$205/Sq Ft
Est. Value
About This Home
This home is located at 4638 Lenman Ave, North Port, FL 34288 and is currently estimated at $313,637, approximately $204 per square foot. 4638 Lenman Ave is a home located in Sarasota County with nearby schools including Atwater Elementary School, North Port High School, and Woodland Middle School.
Ownership History
Date
Name
Owned For
Owner Type
Purchase Details
Closed on
Jul 1, 2016
Bought by
Sinisi John J
Current Estimated Value
Purchase Details
Closed on
Oct 26, 2015
Sold by
J J Sinisi Maintenance Inc
Bought by
Adams Homes Of Northwest Florida Inc
Purchase Details
Closed on
Aug 25, 2015
Sold by
Menezes Clifford A
Bought by
J J Sinisi Maintenance Inc
Purchase Details
Closed on
Apr 3, 2015
Sold by
Mcallister Thomas C and Mcallister Gloria
Bought by
Menezes Clifford A
Purchase Details
Closed on
Jul 27, 2007
Sold by
Da Investments Of Swfl Inc
Bought by
Mcallister Thomas C and Mcallister Gloria
Purchase Details
Closed on
Jul 20, 2005
Sold by
Memorial Assets Inc
Bought by
Da Investments Of Swfl Inc
Purchase Details
Closed on
Jan 18, 2002
Sold by
Wong Po C P and Wong Wing Y
Bought by
Memorial Assets Inc
Purchase Details
Closed on
Sep 19, 2000
Sold by
Nationsbank Fl N A
Bought by
Wong Po C P and Wong Wing Y
Create a Home Valuation Report for This Property
The Home Valuation Report is an in-depth analysis detailing your home's value as well as a comparison with similar homes in the area
Home Values in the Area
Average Home Value in this Area
Purchase History
| Date | Buyer | Sale Price | Title Company |
|---|---|---|---|
| Sinisi John J | $177,800 | -- | |
| Adams Homes Of Northwest Florida Inc | $3,000 | Attorney | |
| J J Sinisi Maintenance Inc | $8,000 | Siesta Title & Escrow Llc | |
| Menezes Clifford A | $4,000 | Siesta Title & Escrow Llc | |
| Mcallister Thomas C | $17,500 | Towns Title & Co | |
| Da Investments Of Swfl Inc | $64,000 | Towns Title & Co | |
| Memorial Assets Inc | $15,300 | -- | |
| Memorial Assets Inc | $15,300 | -- | |
| Wong Po C P | $17,900 | -- |
Source: Public Records
Tax History Compared to Growth
Tax History
| Year | Tax Paid | Tax Assessment Tax Assessment Total Assessment is a certain percentage of the fair market value that is determined by local assessors to be the total taxable value of land and additions on the property. | Land | Improvement |
|---|---|---|---|---|
| 2024 | $4,408 | $228,533 | -- | -- |
| 2023 | $4,408 | $292,500 | $16,900 | $275,600 |
| 2022 | $4,112 | $269,900 | $17,500 | $252,400 |
| 2021 | $3,378 | $171,700 | $7,400 | $164,300 |
| 2020 | $3,390 | $170,600 | $6,000 | $164,600 |
| 2019 | $3,148 | $156,300 | $6,500 | $149,800 |
| 2018 | $3,044 | $158,800 | $6,400 | $152,400 |
| 2017 | $2,907 | $149,000 | $4,000 | $145,000 |
| 2016 | $589 | $3,300 | $3,300 | $0 |
| 2015 | $354 | $3,700 | $3,700 | $0 |
| 2014 | -- | $3,300 | $0 | $0 |
Source: Public Records
Map
Nearby Homes
- LOT 13 Waller Rd
- 0 Sweden Ave
- Lot 5 Wilburn Terrace
- 0 Wilburn Terrace Unit MFRC7490562
- 2628 Wilburn Terrace
- 2576 Wilburn Terrace
- Lot 22 Addley Ave
- 0 Waller Rd Unit MFRTB8376344
- 0 Waller Rd Unit MFRC7498272
- 2845 Lawyer Terrace
- 4506 Georgia Ave
- 3722 Atwater Dr
- 2261 Barrister St
- 0 Abate Ave
- 0 Billberry St Unit 3 225004717
- 0 Billberry St Unit MFRC7514435
- 0 Jericho Ave Unit A4553291
- 0 Jericho Ave Unit MFRC7512706
- 0 Jericho Ave Unit MFRN6140469
- 5018 Cillette Ave
- 4624 Lenman Ave
- 2570 Greenland St
- 0 Lenman Ave
- 4633 Lenman Ave
- 2552 Greenland St
- 2431 Waller Rd
- 4675 Lenman Ave
- 4682 Sweden Ave
- 2636 Greenland St
- 0 Lot 24 Waller Rd Unit C7030502
- 2587 Waller Rd
- 0 Greenland St Unit D5917551
- 0 Waller Rd Unit C7240866
- Lenman Ave
- Lenman Ave
- Lot 12 Sweden Ave
- Lot 5 Waller Rd
- 21 Waller Rd
- 2552 Waller Rd
- 4714 Addley Ave