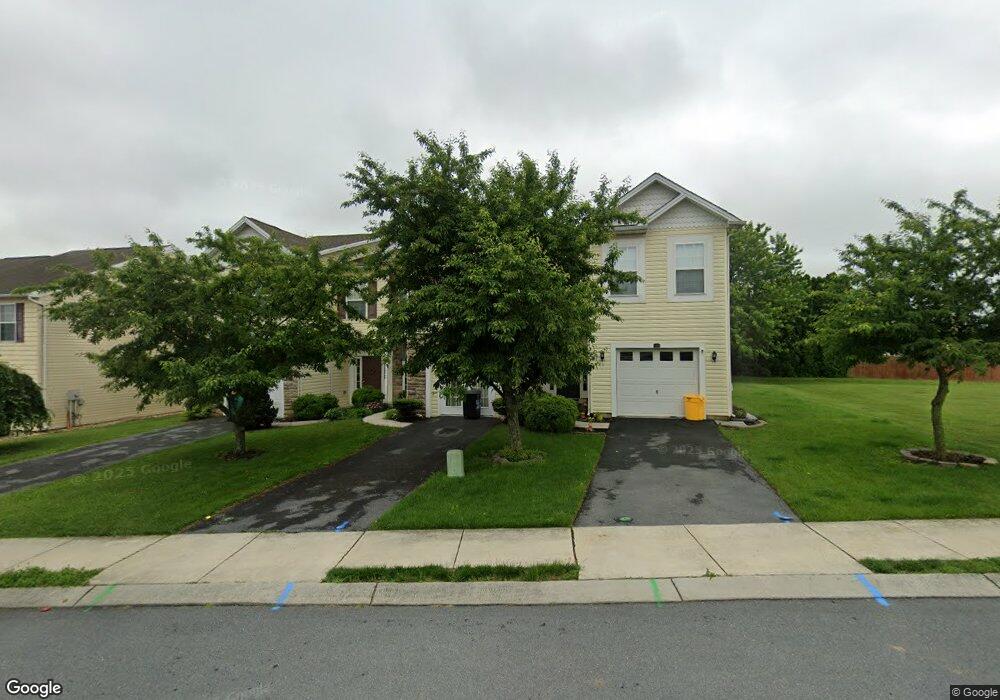
464 Lantern Ln Chambersburg, PA 17201
Estimated Value: $136,101 - $262,000
3
Beds
3
Baths
1,645
Sq Ft
$132/Sq Ft
Est. Value
About This Home
This home is located at 464 Lantern Ln, Chambersburg, PA 17201 and is currently estimated at $217,025, approximately $131 per square foot. 464 Lantern Ln is a home located in Franklin County with nearby schools including Chambersburg Area Middle School - North, Chambersburg Area Senior High School, and Cumberland Valley Christian School.
Ownership History
Date
Name
Owned For
Owner Type
Purchase Details
Closed on
Oct 13, 2014
Sold by
Johnson Julie D and Johnson Michael L
Bought by
Johnson Michael L
Current Estimated Value
Home Financials for this Owner
Home Financials are based on the most recent Mortgage that was taken out on this home.
Original Mortgage
$105,200
Outstanding Balance
$80,651
Interest Rate
4.1%
Mortgage Type
New Conventional
Estimated Equity
$136,374
Purchase Details
Closed on
Feb 23, 2010
Sold by
Rachuba Land B Llc
Bought by
Johnson Julie D and Johnson Michael L
Home Financials for this Owner
Home Financials are based on the most recent Mortgage that was taken out on this home.
Original Mortgage
$107,900
Interest Rate
5%
Mortgage Type
New Conventional
Purchase Details
Closed on
Dec 22, 2009
Sold by
Fairmount Real Estate Services Of Pa Llc
Bought by
Rachuba Land B Llc
Create a Home Valuation Report for This Property
The Home Valuation Report is an in-depth analysis detailing your home's value as well as a comparison with similar homes in the area
Home Values in the Area
Average Home Value in this Area
Purchase History
| Date | Buyer | Sale Price | Title Company |
|---|---|---|---|
| Johnson Michael L | -- | None Available | |
| Johnson Julie D | $134,900 | Title Resources Guaranty Co | |
| Rachuba Land B Llc | $124,566 | Residential Title & Escrow C |
Source: Public Records
Mortgage History
| Date | Status | Borrower | Loan Amount |
|---|---|---|---|
| Open | Johnson Michael L | $105,200 | |
| Closed | Johnson Julie D | $107,900 |
Source: Public Records
Tax History Compared to Growth
Tax History
| Year | Tax Paid | Tax Assessment Tax Assessment Total Assessment is a certain percentage of the fair market value that is determined by local assessors to be the total taxable value of land and additions on the property. | Land | Improvement |
|---|---|---|---|---|
| 2025 | $3,226 | $16,260 | $840 | $15,420 |
| 2024 | $3,094 | $16,260 | $840 | $15,420 |
| 2023 | $3,015 | $16,260 | $840 | $15,420 |
| 2022 | $2,932 | $16,260 | $840 | $15,420 |
| 2021 | $2,916 | $16,260 | $840 | $15,420 |
| 2020 | $2,852 | $16,260 | $840 | $15,420 |
| 2019 | $2,769 | $16,260 | $840 | $15,420 |
| 2018 | $2,684 | $16,260 | $840 | $15,420 |
| 2017 | $2,529 | $16,260 | $840 | $15,420 |
| 2016 | $466 | $16,260 | $840 | $15,420 |
| 2015 | $434 | $16,260 | $840 | $15,420 |
| 2014 | $434 | $16,260 | $840 | $15,420 |
Source: Public Records
Map
Nearby Homes
- 221 Lantern Ln
- 1448 Hollywell Ave
- 0 Benedict Ave Unit PAFL2022468
- 234 Lantern Ln
- 236 Benedict Ave
- 217 Mill Rd Unit 4
- 934 Samerica Dr
- 712 S 2nd St
- 414 Cumberland Ave
- 583 S 2nd St
- 1164 Paper Mill Rd
- 292 Cherry Lane Dr
- 119 E Catherine St
- 601 Kittatinny Dr
- 139 E Catherine St
- 1126 Crottlestown Rd
- 842 Woodlawn Dr
- 710 Cumberland Ave
- 1401 Pleasantview Dr
- 84 Sunset Ave
- 462 Lantern Ln
- 466 Lantern Ln
- 457 Lantern Ln
- 428 Martina Dr
- 430 Martina Dr
- 424 Martina Dr
- 422 Martina Dr Unit 41
- 422 Martina Dr
- 383 Lantern Ln
- 371 Lantern Ln
- 397 Lantern Ln
- 348 Lantern Ln
- 355 Lantern Ln
- 359 Lantern Ln
- 363 Lantern Ln
- 352 Lantern Ln
- 375 Lantern Ln
- 379 Lantern Ln
- 395 Lantern Ln
- 344 Lantern Ln