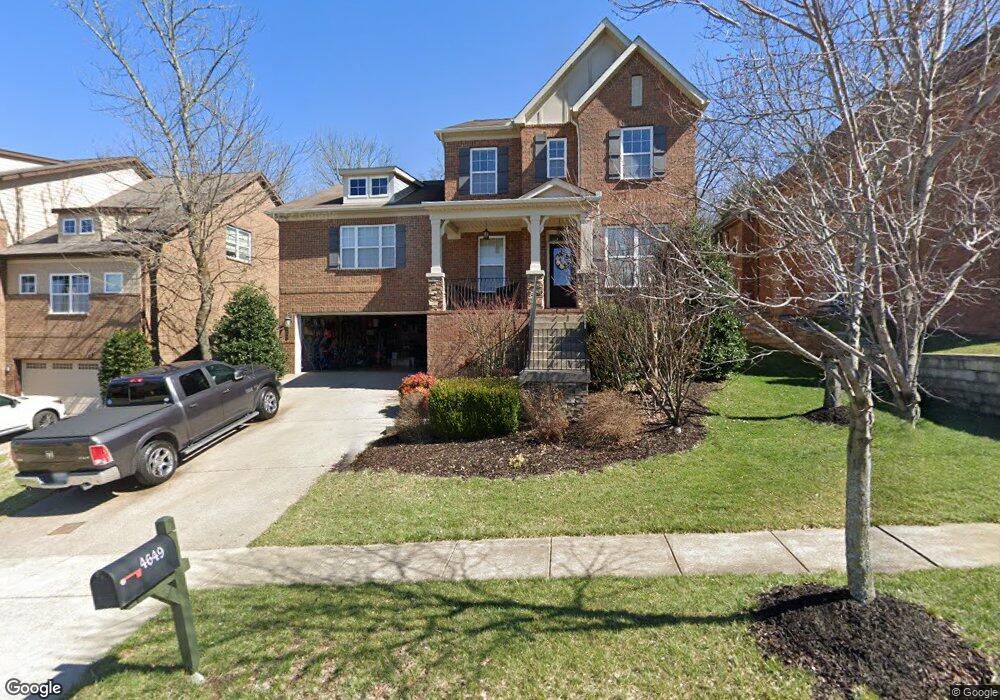
4649 Sawmill Place Nolensville, TN 37135
Estimated Value: $653,000 - $707,000
3
Beds
4
Baths
2,510
Sq Ft
$270/Sq Ft
Est. Value
About This Home
This home is located at 4649 Sawmill Place, Nolensville, TN 37135 and is currently estimated at $677,153, approximately $269 per square foot. 4649 Sawmill Place is a home located in Williamson County with nearby schools including Mill Creek Elementary School, Mill Creek Middle School, and Nolensville High School.
Ownership History
Date
Name
Owned For
Owner Type
Purchase Details
Closed on
Mar 21, 2013
Sold by
Alonzo Richard and Alonzo Naomi
Bought by
Hart John G and Hart Angela M
Current Estimated Value
Home Financials for this Owner
Home Financials are based on the most recent Mortgage that was taken out on this home.
Original Mortgage
$280,250
Interest Rate
3.79%
Mortgage Type
New Conventional
Purchase Details
Closed on
Oct 8, 2010
Sold by
Citizens Homes Inc
Bought by
Alonzo Richard and Oku Alonzo Naomi
Home Financials for this Owner
Home Financials are based on the most recent Mortgage that was taken out on this home.
Original Mortgage
$259,124
Interest Rate
4.36%
Mortgage Type
FHA
Purchase Details
Closed on
Sep 24, 2009
Sold by
Ck Development Llc
Bought by
Citizens Homes Inc
Create a Home Valuation Report for This Property
The Home Valuation Report is an in-depth analysis detailing your home's value as well as a comparison with similar homes in the area
Home Values in the Area
Average Home Value in this Area
Purchase History
| Date | Buyer | Sale Price | Title Company |
|---|---|---|---|
| Hart John G | $295,000 | Stewart Title Company | |
| Alonzo Richard | $262,614 | Lawyers | |
| Citizens Homes Inc | $220,000 | None Available |
Source: Public Records
Mortgage History
| Date | Status | Borrower | Loan Amount |
|---|---|---|---|
| Previous Owner | Hart John G | $280,250 | |
| Previous Owner | Alonzo Richard | $259,124 |
Source: Public Records
Tax History Compared to Growth
Tax History
| Year | Tax Paid | Tax Assessment Tax Assessment Total Assessment is a certain percentage of the fair market value that is determined by local assessors to be the total taxable value of land and additions on the property. | Land | Improvement |
|---|---|---|---|---|
| 2025 | $2,246 | $160,175 | $42,500 | $117,675 |
| 2024 | $2,246 | $103,500 | $21,250 | $82,250 |
| 2023 | $2,246 | $103,500 | $21,250 | $82,250 |
| 2022 | $2,246 | $103,500 | $21,250 | $82,250 |
| 2021 | $2,246 | $103,500 | $21,250 | $82,250 |
| 2020 | $2,051 | $81,700 | $16,250 | $65,450 |
| 2019 | $1,937 | $81,700 | $16,250 | $65,450 |
| 2018 | $1,880 | $81,700 | $16,250 | $65,450 |
| 2017 | $1,863 | $81,700 | $16,250 | $65,450 |
| 2016 | $0 | $81,700 | $16,250 | $65,450 |
| 2015 | -- | $68,425 | $13,750 | $54,675 |
| 2014 | -- | $68,425 | $13,750 | $54,675 |
Source: Public Records
Map
Nearby Homes
- 4592 Sawmill Place
- 143 Lodge Hall Rd
- 4800 Powder Springs Rd
- 4609 Van Leer Ct
- 5100 Aunt Nannies Place
- 4528 Sawmill Place
- 6191 Christmas Dr
- 104 Lodge Hall Rd
- 5028 Burke Trail
- 7024 Fishing Creek Rd
- 9707 Clovercroft Rd
- 244 Siegert Place
- 304 Thesing Ct
- 220 Siegert Place
- 136 Madison Mill Dr
- 2025 Delaware Dr
- 2029 Delaware Dr
- 9918 Sam Donald Rd
- 2203 Carouth Ct
- 130 Brooksbank Dr
- 4645 Sawmill Place
- 4653 Sawmill Place
- 4641 Sawmill Place
- 4657 Sawmill Place
- 4648 Sawmill Place
- 4644 Sawmill Place
- 1376 Jersey Farm Rd
- 4635 Sawmill Place
- 4661 Sawmill Place
- 4640 Sawmill Place
- 4636 Sawmill Place
- 1380 Jersey Farm Rd
- 4656 Sawmill Place
- 4660 Sawmill Place
- 4669 Sawmill Place
- 4631 Sawmill Place
- 4664 Sawmill Place
- 1384 Jersey Farm Rd
- 6000 Christmas Dr
- 4632 Sawmill Place