Estimated Value: $295,000 - $355,000
--
Bed
2
Baths
1,232
Sq Ft
$270/Sq Ft
Est. Value
About This Home
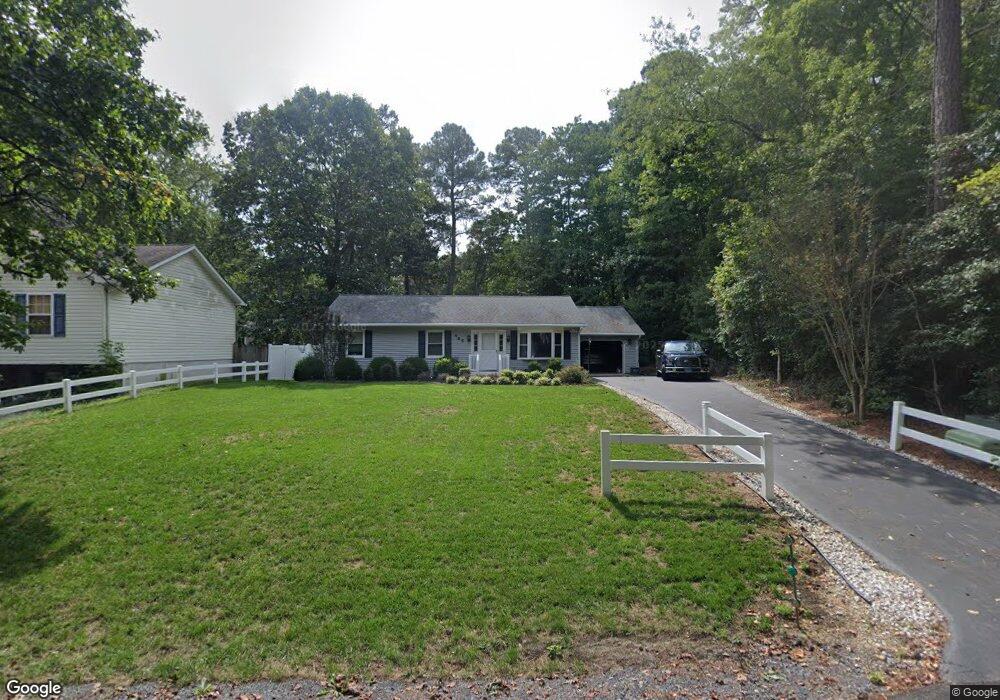
This home is located at 465 Deer Ln, Lusby, MD 20657 and is currently estimated at $332,585, approximately $269 per square foot. 465 Deer Ln is a home located in Calvert County with nearby schools including Dowell Elementary School, Mill Creek Middle School, and Patuxent High School.
Ownership History
Date
Name
Owned For
Owner Type
Purchase Details
Closed on
Dec 3, 1998
Sold by
Cullison Richard W
Bought by
Laxsus Charles J
Current Estimated Value
Purchase Details
Closed on
Jul 5, 1996
Sold by
Byrd Roy A and Byrd Kathleen M
Bought by
Cullison Richard W and Cullison Audrey M
Purchase Details
Closed on
Oct 2, 1989
Sold by
Gilliland Theodore Alan
Bought by
Byrd Roy A and Byrd Kathleen M
Home Financials for this Owner
Home Financials are based on the most recent Mortgage that was taken out on this home.
Original Mortgage
$79,200
Interest Rate
10.16%
Create a Home Valuation Report for This Property
The Home Valuation Report is an in-depth analysis detailing your home's value as well as a comparison with similar homes in the area
Home Values in the Area
Average Home Value in this Area
Purchase History
| Date | Buyer | Sale Price | Title Company |
|---|---|---|---|
| Laxsus Charles J | $109,900 | -- | |
| Cullison Richard W | $102,000 | -- | |
| Byrd Roy A | $78,400 | -- |
Source: Public Records
Mortgage History
| Date | Status | Borrower | Loan Amount |
|---|---|---|---|
| Previous Owner | Byrd Roy A | $79,200 | |
| Closed | Cullison Richard W | -- |
Source: Public Records
Tax History Compared to Growth
Tax History
| Year | Tax Paid | Tax Assessment Tax Assessment Total Assessment is a certain percentage of the fair market value that is determined by local assessors to be the total taxable value of land and additions on the property. | Land | Improvement |
|---|---|---|---|---|
| 2025 | $2,815 | $245,000 | $0 | $0 |
| 2024 | $2,815 | $224,600 | $0 | $0 |
| 2023 | $2,511 | $204,200 | $67,200 | $137,000 |
| 2022 | $2,068 | $199,000 | $0 | $0 |
| 2021 | $4,907 | $193,800 | $0 | $0 |
| 2020 | $2,289 | $188,600 | $67,200 | $121,400 |
| 2019 | $1,923 | $183,333 | $0 | $0 |
| 2018 | $1,868 | $178,067 | $0 | $0 |
| 2017 | $2,123 | $172,800 | $0 | $0 |
| 2016 | -- | $171,533 | $0 | $0 |
| 2015 | $2,218 | $170,267 | $0 | $0 |
| 2014 | $2,218 | $169,000 | $0 | $0 |
Source: Public Records
Map
Nearby Homes