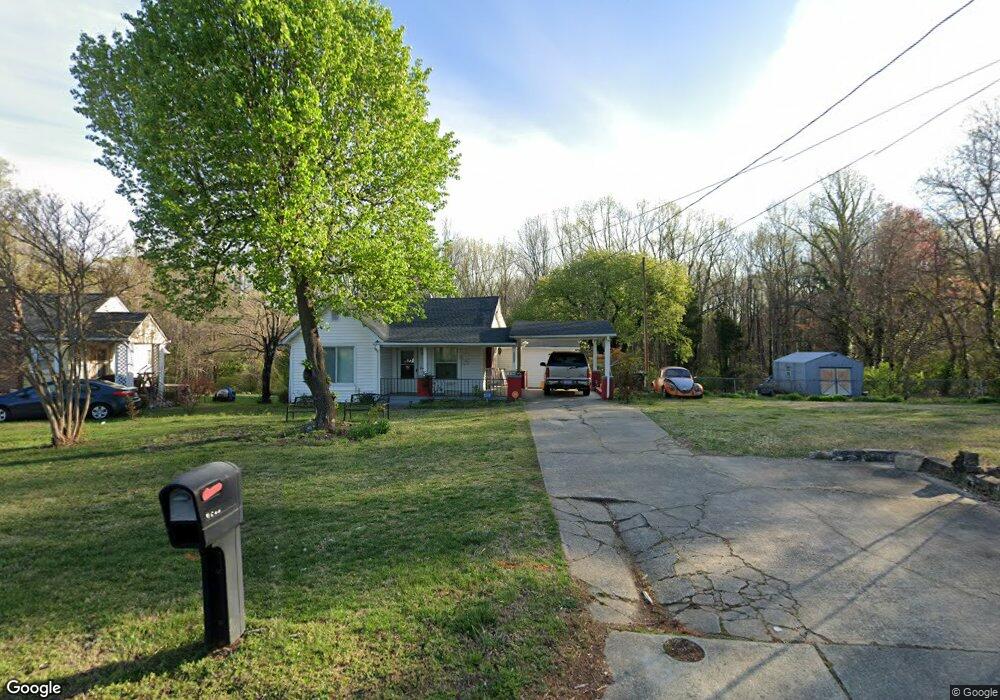
4655 Indiana Ave Winston Salem, NC 27106
Stonewall/Salemtowne NeighborhoodEstimated Value: $163,000 - $238,000
3
Beds
2
Baths
1,821
Sq Ft
$116/Sq Ft
Est. Value
About This Home
This home is located at 4655 Indiana Ave, Winston Salem, NC 27106 and is currently estimated at $210,536, approximately $115 per square foot. 4655 Indiana Ave is a home located in Forsyth County with nearby schools including North Hills Elementary School, Hanes Middle, and North Forsyth High.
Ownership History
Date
Name
Owned For
Owner Type
Purchase Details
Closed on
May 27, 2010
Sold by
Benjamin Juanita C
Bought by
Benjamin Cynthia C
Current Estimated Value
Purchase Details
Closed on
Mar 4, 2004
Sold by
Benjamin John A and Benjamin Monica H
Bought by
Benjamin Juanita C
Purchase Details
Closed on
Sep 15, 2003
Sold by
Brown Christopher and Brown Jeanette L Benjamin
Bought by
Benjamin Juanita C
Purchase Details
Closed on
Sep 5, 2003
Sold by
Benjamin Ronald F and Benjamin Lucinda
Bought by
Benjamin Juanita C
Purchase Details
Closed on
Sep 3, 2003
Sold by
Woltz Adrian C and Woltz Loretta D
Bought by
Benjamin Juanita C
Purchase Details
Closed on
Aug 28, 2003
Sold by
Foy Freddie J and Foy Marilyn G Benjamin
Bought by
Benjamin Juanita C
Purchase Details
Closed on
Aug 18, 2003
Sold by
Benjamin Lynn W and Benjamin Susan M
Bought by
Benjamin Juanita C
Purchase Details
Closed on
Aug 5, 2003
Sold by
Benjamin Cynthia C
Bought by
Benjamin Juanita C
Create a Home Valuation Report for This Property
The Home Valuation Report is an in-depth analysis detailing your home's value as well as a comparison with similar homes in the area
Home Values in the Area
Average Home Value in this Area
Purchase History
| Date | Buyer | Sale Price | Title Company |
|---|---|---|---|
| Benjamin Cynthia C | -- | None Available | |
| Benjamin Juanita C | -- | -- | |
| Benjamin Juanita C | -- | -- | |
| Benjamin Juanita C | -- | -- | |
| Benjamin Juanita C | -- | -- | |
| Benjamin Juanita C | -- | -- | |
| Benjamin Juanita C | -- | -- | |
| Benjamin Juanita C | -- | -- |
Source: Public Records
Tax History Compared to Growth
Tax History
| Year | Tax Paid | Tax Assessment Tax Assessment Total Assessment is a certain percentage of the fair market value that is determined by local assessors to be the total taxable value of land and additions on the property. | Land | Improvement |
|---|---|---|---|---|
| 2025 | $756 | $105,400 | $12,000 | $93,400 |
| 2024 | $722 | $53,900 | $10,000 | $43,900 |
| 2023 | $722 | $53,900 | $10,000 | $43,900 |
| 2022 | $708 | $53,900 | $10,000 | $43,900 |
| 2021 | $695 | $53,900 | $10,000 | $43,900 |
| 2020 | $541 | $39,200 | $5,600 | $33,600 |
| 2019 | $545 | $39,200 | $5,600 | $33,600 |
| 2018 | $536 | $39,200 | $5,600 | $33,600 |
| 2016 | $437 | $33,188 | $6,000 | $27,188 |
| 2015 | $430 | $33,188 | $6,000 | $27,188 |
| 2014 | $417 | $33,188 | $6,000 | $27,188 |
Source: Public Records
Map
Nearby Homes
- 4656 Walcott St
- 4798 Cherry St
- 4915 Rumley Cir
- 133 Lodge St
- 0 Methodist Dr
- 5015 Farmoor Cir
- 4954 Home Rd NW
- 4967 Trent Hill Dr
- 345 Retnuh Dr
- 0 University Pkwy Unit 1131791
- 1168 Academic Dr
- 524 Scholastic Ct Unit 524
- 228 Barlow Cir
- 219 Craft Dr
- 331 Scholastic Ct Unit 331
- 132 Scholastic Ct Unit 132
- 134 Scholastic Ct Unit 134
- 423 Scholastic Dr Unit 423
- 4203 Dellwood Dr
- 625 Polo Rd
- 4661 Indiana Ave
- 4663 Indiana Ave
- 4654 Indiana Ave
- 4664 Superior Dr
- 4673 Indiana Ave
- 4660 Indiana Ave
- 4635 Indiana Ave
- 4670 Indiana Ave
- 4640 Indiana Ave
- 4625 Indiana Ave
- 4675 Superior Dr
- 4693 Indiana Ave
- 4620 Indiana Ave
- 4665 Walcott St
- 4614 Indiana Ave
- 4695 Indiana Ave
- 4610 Indiana Ave
- 4700 Indiana Ave
- 0 Walcott st Walcott St
- 4637 Tobacco St