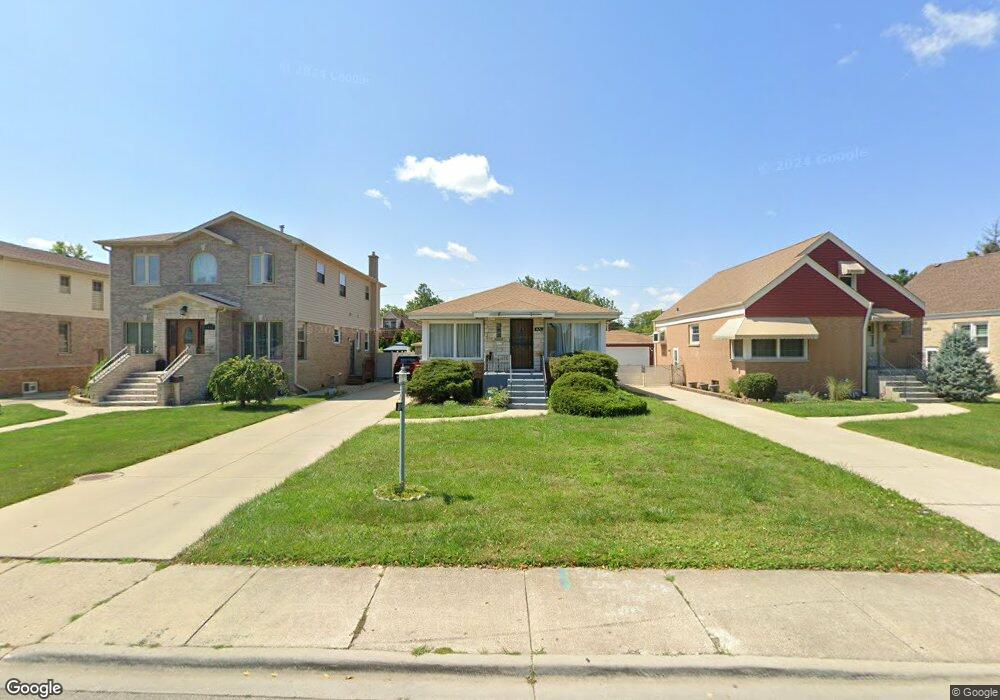
4656 N Narragansett Ave Harwood Heights, IL 60706
Estimated Value: $378,000 - $436,000
3
Beds
2
Baths
1,260
Sq Ft
$324/Sq Ft
Est. Value
About This Home
This home is located at 4656 N Narragansett Ave, Harwood Heights, IL 60706 and is currently estimated at $408,178, approximately $323 per square foot. 4656 N Narragansett Ave is a home located in Cook County with nearby schools including Union Ridge Elementary School, Ridgewood Community High School, and St. Robert Bellarmine Catholic School.
Ownership History
Date
Name
Owned For
Owner Type
Purchase Details
Closed on
Mar 31, 2014
Sold by
Mytnychuk Anastasia
Bought by
Mytnychuk Anastasia and Mytnychuk Leonida
Current Estimated Value
Purchase Details
Closed on
Dec 17, 2012
Sold by
Mytnychuk Leonida and Mytnychuk Anastasiya
Bought by
Mytnychuk Anastasiya
Purchase Details
Closed on
Jun 12, 2009
Sold by
Parkway Bank & Trust Company
Bought by
Mytnychuk Leonida and Mytnychuk Anastasiya
Home Financials for this Owner
Home Financials are based on the most recent Mortgage that was taken out on this home.
Original Mortgage
$184,000
Interest Rate
5.43%
Mortgage Type
Unknown
Purchase Details
Closed on
Aug 26, 2005
Sold by
Dabek Maria
Bought by
Parkway Bank & Trust Co and Trust #13740
Purchase Details
Closed on
Aug 25, 2005
Sold by
Dabek Adam and Dabek Karen
Bought by
Parkway Bank & Trust Co and Trust #13740
Create a Home Valuation Report for This Property
The Home Valuation Report is an in-depth analysis detailing your home's value as well as a comparison with similar homes in the area
Home Values in the Area
Average Home Value in this Area
Purchase History
| Date | Buyer | Sale Price | Title Company |
|---|---|---|---|
| Mytnychuk Anastasia | -- | None Available | |
| Mytnychuk Anastasiya | -- | Security Holdings Llc | |
| Mytnychuk Leonida | $230,000 | First American Title | |
| Parkway Bank & Trust Co | -- | Ticor Title Insurance Compan | |
| Parkway Bank & Trust Co | -- | Ticor Title Insurance Compan |
Source: Public Records
Mortgage History
| Date | Status | Borrower | Loan Amount |
|---|---|---|---|
| Previous Owner | Mytnychuk Leonida | $184,000 |
Source: Public Records
Tax History Compared to Growth
Tax History
| Year | Tax Paid | Tax Assessment Tax Assessment Total Assessment is a certain percentage of the fair market value that is determined by local assessors to be the total taxable value of land and additions on the property. | Land | Improvement |
|---|---|---|---|---|
| 2024 | $7,201 | $32,000 | $7,488 | $24,512 |
| 2023 | $6,960 | $32,000 | $7,488 | $24,512 |
| 2022 | $6,960 | $32,000 | $7,488 | $24,512 |
| 2021 | $6,376 | $26,537 | $6,624 | $19,913 |
| 2020 | $6,245 | $26,537 | $6,624 | $19,913 |
| 2019 | $6,230 | $29,783 | $6,624 | $23,159 |
| 2018 | $6,007 | $25,066 | $5,472 | $19,594 |
| 2017 | $5,896 | $25,066 | $5,472 | $19,594 |
| 2016 | $5,813 | $25,066 | $5,472 | $19,594 |
| 2015 | $4,775 | $19,507 | $4,752 | $14,755 |
| 2014 | $5,596 | $22,587 | $4,752 | $17,835 |
| 2013 | $4,980 | $22,587 | $4,752 | $17,835 |
Source: Public Records
Map
Nearby Homes
- 4544 N Mulligan Ave
- 6352 W Giddings St
- 4526 N Mobile Ave
- 4546 N Merrimac Ave
- 6316 W Lawrence Ave
- 4567 N Merrimac Ave
- 4433 N Narragansett Ave
- 6228 W Lawrence Ave
- 6519 W Forest Preserve Ave
- 6420 W Gunnison St
- 4447 N Merrimac Ave
- 4824 N Natchez Ave
- 6450 W Montrose Ave
- 6137 W Giddings St
- 6520 W Gunnison St
- 4442 N Melvina Ave
- 6140 W Gunnison St Unit 3
- 6046 W Giddings St
- 4305 N Mobile Ave
- 4702 N Austin Ave Unit 302
- 4662 N Narragansett Ave
- 4652 N Narragansett Ave
- 4668 N Narragansett Ave
- 4646 N Narragansett Ave
- 4655 N Nagle Ave
- 4659 N Nagle Ave
- 4672 N Narragansett Ave
- 4672 N Narragansett Ave
- 4642 N Narragansett Ave
- 4651 N Nagle Ave
- 4663 N Nagle Ave
- 4645 N Nagle Ave
- 4665 N Nagle Ave
- 4638 N Narragansett Ave
- 4641 N Nagle Ave
- 6354 W Eastwood Ave
- 4701 N Nagle Ave
- 4702 N Narragansett Ave
- 4634 N Narragansett Ave
- 6346 W Eastwood Ave