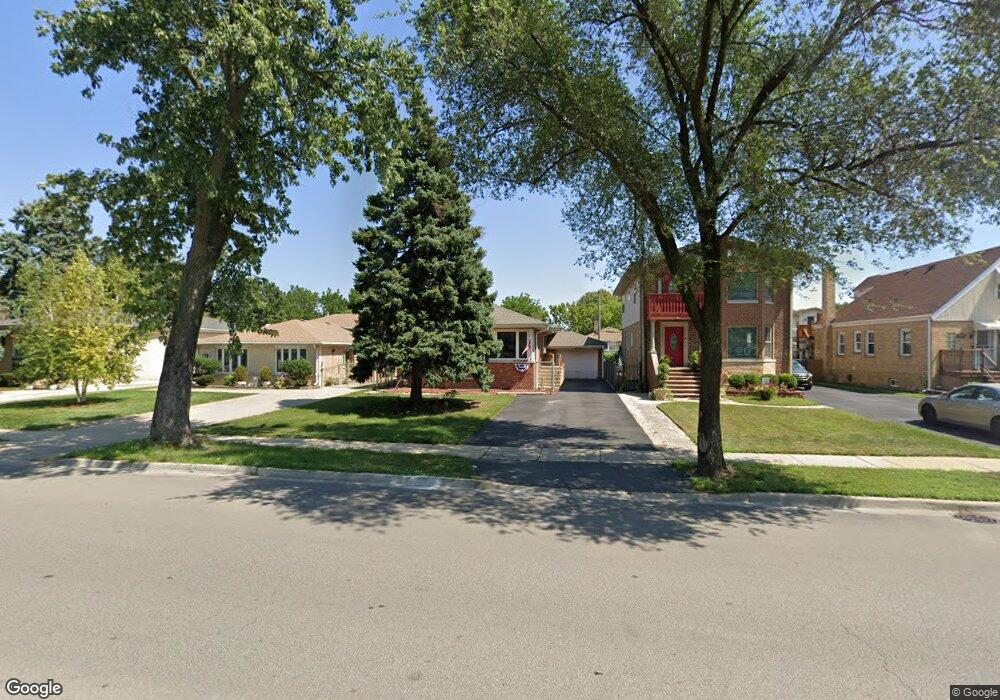
4659 N Nagle Ave Harwood Heights, IL 60706
Estimated Value: $318,000 - $451,000
3
Beds
1
Bath
1,020
Sq Ft
$385/Sq Ft
Est. Value
About This Home
This home is located at 4659 N Nagle Ave, Harwood Heights, IL 60706 and is currently estimated at $393,207, approximately $385 per square foot. 4659 N Nagle Ave is a home located in Cook County with nearby schools including Union Ridge Elementary School, Ridgewood Community High School, and St. Robert Bellarmine Catholic School.
Ownership History
Date
Name
Owned For
Owner Type
Purchase Details
Closed on
Mar 18, 2020
Sold by
Granda Juan and Granda Ximena
Bought by
Granda Ximena
Current Estimated Value
Purchase Details
Closed on
Jun 17, 1999
Sold by
Maentanis Joseph P and Maentanis Susan M
Bought by
Granda Juan and Granda Ximena
Home Financials for this Owner
Home Financials are based on the most recent Mortgage that was taken out on this home.
Original Mortgage
$208,590
Outstanding Balance
$56,101
Interest Rate
7.29%
Mortgage Type
FHA
Estimated Equity
$337,106
Purchase Details
Closed on
Sep 10, 1993
Sold by
Niepolski Anna and Niepolski Richard
Bought by
Maentanis Joseph P and Maentanis Susan M
Home Financials for this Owner
Home Financials are based on the most recent Mortgage that was taken out on this home.
Original Mortgage
$126,000
Interest Rate
7.24%
Create a Home Valuation Report for This Property
The Home Valuation Report is an in-depth analysis detailing your home's value as well as a comparison with similar homes in the area
Home Values in the Area
Average Home Value in this Area
Purchase History
| Date | Buyer | Sale Price | Title Company |
|---|---|---|---|
| Granda Ximena | -- | Attorney | |
| Granda Juan | $210,000 | -- | |
| Maentanis Joseph P | $98,666 | -- |
Source: Public Records
Mortgage History
| Date | Status | Borrower | Loan Amount |
|---|---|---|---|
| Open | Granda Juan | $208,590 | |
| Previous Owner | Maentanis Joseph P | $126,000 |
Source: Public Records
Tax History Compared to Growth
Tax History
| Year | Tax Paid | Tax Assessment Tax Assessment Total Assessment is a certain percentage of the fair market value that is determined by local assessors to be the total taxable value of land and additions on the property. | Land | Improvement |
|---|---|---|---|---|
| 2024 | $6,699 | $30,000 | $7,488 | $22,512 |
| 2023 | $6,473 | $30,000 | $7,488 | $22,512 |
| 2022 | $6,473 | $30,000 | $7,488 | $22,512 |
| 2021 | $5,664 | $23,944 | $6,624 | $17,320 |
| 2020 | $5,554 | $23,944 | $6,624 | $17,320 |
| 2019 | $5,542 | $26,873 | $6,624 | $20,249 |
| 2018 | $5,346 | $22,684 | $5,472 | $17,212 |
| 2017 | $5,249 | $22,684 | $5,472 | $17,212 |
| 2016 | $5,199 | $22,684 | $5,472 | $17,212 |
| 2015 | $5,004 | $20,319 | $4,752 | $15,567 |
| 2014 | $4,962 | $20,319 | $4,752 | $15,567 |
| 2013 | $4,873 | $20,319 | $4,752 | $15,567 |
Source: Public Records
Map
Nearby Homes
- 4544 N Mulligan Ave
- 6352 W Giddings St
- 4526 N Mobile Ave
- 4546 N Merrimac Ave
- 6316 W Lawrence Ave
- 4433 N Narragansett Ave
- 4567 N Merrimac Ave
- 6519 W Forest Preserve Ave
- 6420 W Gunnison St
- 6450 W Montrose Ave
- 6228 W Lawrence Ave
- 4824 N Natchez Ave
- 4447 N Merrimac Ave
- 6520 W Gunnison St
- 6137 W Giddings St
- 4442 N Melvina Ave
- 6140 W Gunnison St Unit 3
- 4305 N Mobile Ave
- 6046 W Giddings St
- 4841 N Rutherford Ave
- 4655 N Nagle Ave
- 4663 N Nagle Ave
- 4651 N Nagle Ave
- 4665 N Nagle Ave
- 4662 N Narragansett Ave
- 4656 N Narragansett Ave
- 4645 N Nagle Ave
- 4701 N Nagle Ave
- 4668 N Narragansett Ave
- 4652 N Narragansett Ave
- 4672 N Narragansett Ave
- 4672 N Narragansett Ave
- 4646 N Narragansett Ave
- 4641 N Nagle Ave
- 4703 N Nagle Ave
- 4642 N Narragansett Ave
- 4702 N Narragansett Ave
- 4705 N Nagle Ave
- 4638 N Narragansett Ave
- 4704 N Narragansett Ave