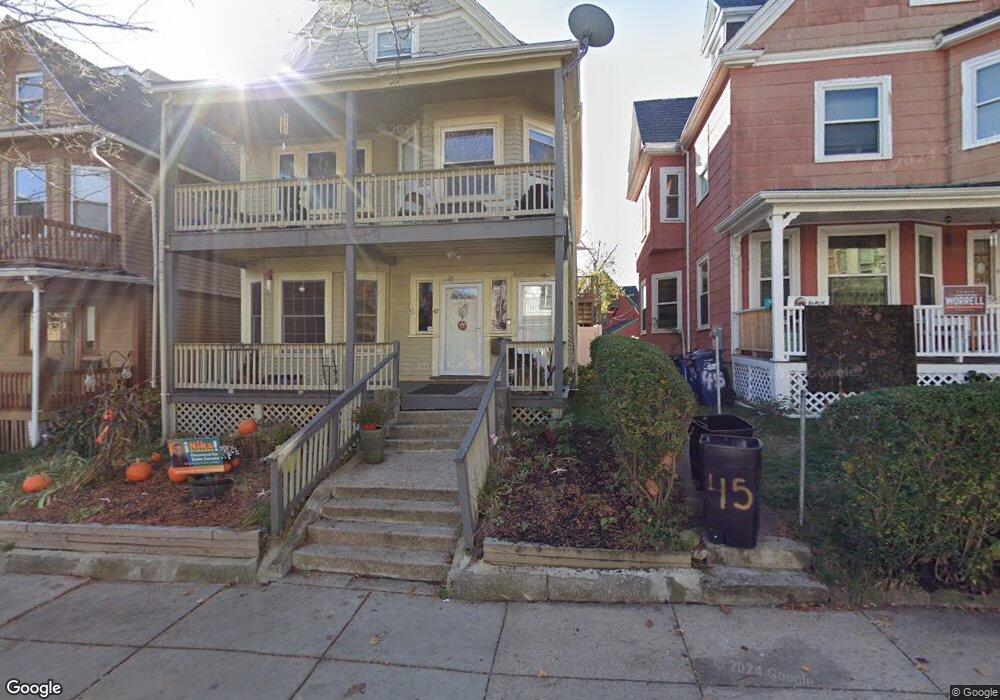
47 Holborn St Dorchester, MA 02121
Sav-Mor NeighborhoodEstimated Value: $759,000 - $935,000
7
Beds
3
Baths
3,005
Sq Ft
$282/Sq Ft
Est. Value
About This Home
This home is located at 47 Holborn St, Dorchester, MA 02121 and is currently estimated at $846,991, approximately $281 per square foot. 47 Holborn St is a home located in Suffolk County with nearby schools including Bridge Boston Charter School and Mother Caroline Academy & Education Center.
Ownership History
Date
Name
Owned For
Owner Type
Purchase Details
Closed on
Dec 31, 2003
Sold by
Williams Barbara G
Bought by
Cooley Nancy L
Current Estimated Value
Home Financials for this Owner
Home Financials are based on the most recent Mortgage that was taken out on this home.
Original Mortgage
$284,200
Outstanding Balance
$132,540
Interest Rate
5.86%
Mortgage Type
Purchase Money Mortgage
Estimated Equity
$714,451
Create a Home Valuation Report for This Property
The Home Valuation Report is an in-depth analysis detailing your home's value as well as a comparison with similar homes in the area
Home Values in the Area
Average Home Value in this Area
Purchase History
| Date | Buyer | Sale Price | Title Company |
|---|---|---|---|
| Cooley Nancy L | $380,000 | -- |
Source: Public Records
Mortgage History
| Date | Status | Borrower | Loan Amount |
|---|---|---|---|
| Open | Cooley Nancy L | $284,200 | |
| Closed | Cooley Nancy L | $76,000 |
Source: Public Records
Tax History Compared to Growth
Tax History
| Year | Tax Paid | Tax Assessment Tax Assessment Total Assessment is a certain percentage of the fair market value that is determined by local assessors to be the total taxable value of land and additions on the property. | Land | Improvement |
|---|---|---|---|---|
| 2025 | $7,592 | $655,600 | $215,300 | $440,300 |
| 2024 | $6,901 | $633,100 | $195,900 | $437,200 |
| 2023 | $6,355 | $591,700 | $183,100 | $408,600 |
| 2022 | $5,852 | $537,900 | $166,400 | $371,500 |
| 2021 | $5,315 | $498,100 | $154,100 | $344,000 |
| 2020 | $4,644 | $439,800 | $141,500 | $298,300 |
| 2019 | $4,332 | $411,000 | $109,300 | $301,700 |
| 2018 | $3,987 | $380,400 | $109,300 | $271,100 |
| 2017 | $4,028 | $380,400 | $109,300 | $271,100 |
| 2016 | $3,737 | $339,700 | $109,300 | $230,400 |
| 2015 | $3,380 | $279,100 | $84,600 | $194,500 |
| 2014 | $3,156 | $250,900 | $84,600 | $166,300 |
Source: Public Records
Map
Nearby Homes
- 2 Otisfield St
- 36-38 Elm Hill Park
- 476 Warren St
- 472 Warren St
- 52 Intervale St
- 495 Warren St
- 175 Howard Ave Unit 2
- 31 Dewey St
- 7 Waumbeck St Unit 3
- 4 Wyoming St Unit 2
- 40 Devon St Unit 3
- 63 Normandy St
- 194 Blue Hill Ave
- 96-98 Woodledge St
- 8 Adrian St
- 16 Wabon St
- 47 Sargent St Unit 3
- 163 Howard Ave
- 12 Danube St
- 28 Wabon St
- 49 Holborn St
- 45 Holborn St
- 51 Holborn St
- 51 Holborn St Unit 5
- 43 Holborn St
- 38 Gaston St
- 41 Holborn St
- 36 Gaston St
- 40 Gaston St
- 40 Gaston St Unit 3
- 40 Gaston St Unit 1
- 315 Blue Hill Ave Unit 6
- 317 Blue Hill Ave
- 34 Gaston St
- 39 Holborn St Unit 39A
- 44 Holborn St
- 32 Gaston St
- 40 Holborn St Unit 5
- 40 Holborn St Unit 3
- 40 Holborn St Unit 2R