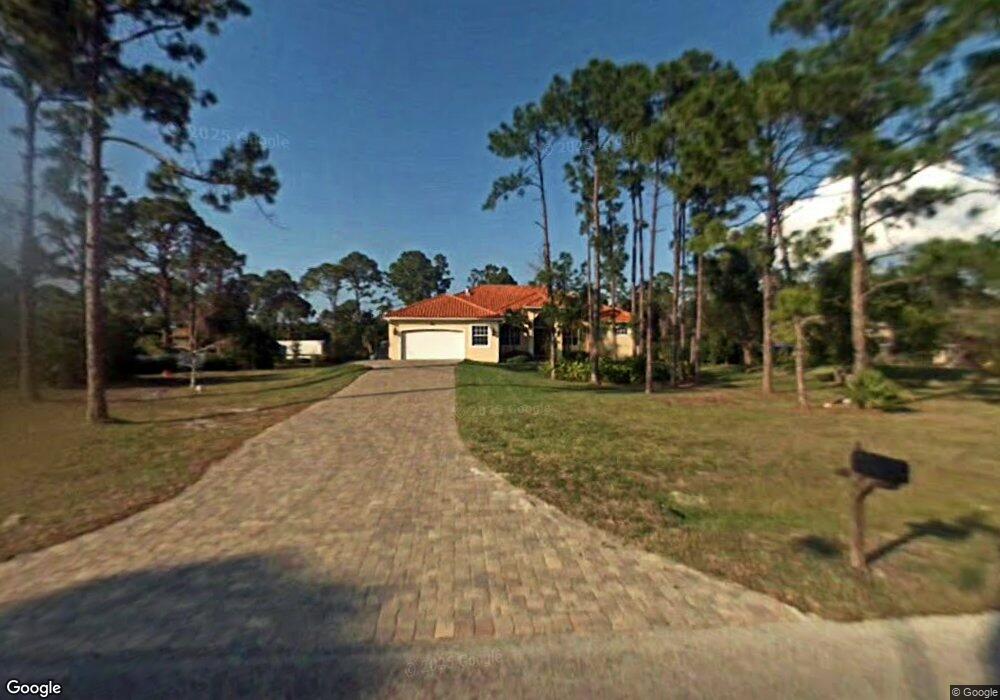
47 Jacaranda Pkwy Cape Coral, FL 33909
Jacaranda NeighborhoodEstimated Value: $686,000 - $739,000
3
Beds
3
Baths
3,238
Sq Ft
$223/Sq Ft
Est. Value
About This Home
This home is located at 47 Jacaranda Pkwy, Cape Coral, FL 33909 and is currently estimated at $723,181, approximately $223 per square foot. 47 Jacaranda Pkwy is a home located in Lee County with nearby schools including Dr. Carrie D. Robinson Littleton Elementary School, Caloosa Elementary School, and Tropic Isles Elementary School.
Ownership History
Date
Name
Owned For
Owner Type
Purchase Details
Closed on
Sep 9, 2025
Sold by
Valdez Helen Garcia and Valdez Eddie
Bought by
Gonzalez Ayanay and Hernandez Alexis
Current Estimated Value
Home Financials for this Owner
Home Financials are based on the most recent Mortgage that was taken out on this home.
Original Mortgage
$707,750
Outstanding Balance
$707,750
Interest Rate
6.72%
Mortgage Type
New Conventional
Estimated Equity
$15,431
Purchase Details
Closed on
Jan 17, 2000
Sold by
Polotto Joseph A and Polotto Florence B
Bought by
Valdez Eddie and Valdez Helen Garcia
Purchase Details
Closed on
Oct 15, 1998
Sold by
Cristantiello James S and Cristantiello Josephine M
Bought by
Polotto Joseph A and Polotto Florence B
Home Financials for this Owner
Home Financials are based on the most recent Mortgage that was taken out on this home.
Original Mortgage
$27,170
Interest Rate
6.61%
Create a Home Valuation Report for This Property
The Home Valuation Report is an in-depth analysis detailing your home's value as well as a comparison with similar homes in the area
Home Values in the Area
Average Home Value in this Area
Purchase History
| Date | Buyer | Sale Price | Title Company |
|---|---|---|---|
| Gonzalez Ayanay | $745,000 | Lux Title Group | |
| Valdez Eddie | $47,000 | -- | |
| Polotto Joseph A | $39,000 | -- |
Source: Public Records
Mortgage History
| Date | Status | Borrower | Loan Amount |
|---|---|---|---|
| Open | Gonzalez Ayanay | $707,750 | |
| Previous Owner | Polotto Joseph A | $27,170 |
Source: Public Records
Tax History Compared to Growth
Tax History
| Year | Tax Paid | Tax Assessment Tax Assessment Total Assessment is a certain percentage of the fair market value that is determined by local assessors to be the total taxable value of land and additions on the property. | Land | Improvement |
|---|---|---|---|---|
| 2025 | $2,145 | $173,808 | -- | -- |
| 2024 | $2,145 | $168,910 | -- | -- |
| 2023 | $2,021 | $163,990 | $0 | $0 |
| 2022 | $1,947 | $159,214 | $0 | $0 |
| 2021 | $1,901 | $350,153 | $86,000 | $264,153 |
| 2020 | $1,866 | $152,443 | $0 | $0 |
| 2019 | $1,850 | $149,016 | $0 | $0 |
| 2018 | $1,853 | $146,237 | $0 | $0 |
| 2017 | $1,903 | $143,229 | $0 | $0 |
| 2016 | $1,864 | $272,570 | $58,480 | $214,090 |
| 2015 | $1,810 | $245,703 | $26,660 | $219,043 |
| 2014 | $1,799 | $181,942 | $23,564 | $158,378 |
| 2013 | -- | $192,116 | $46,400 | $145,716 |
Source: Public Records
Map
Nearby Homes
- 34 Jacaranda Pkwy E
- 17040 Pleasure Rd
- 4217 NE 23rd Place
- 0 Ne Unit 225051212
- 0 Ne Unit MFRC7511822
- 0 Ne Unit MFRC7511821
- 1907 NE 34th Terrace
- 0 Ne Unit 225051220
- 329 NE 6th St
- 3114 NE Juanita Place
- 3203 NW Juanita Place
- 3117 Santa Barbara Blvd N
- 3107 NE 1st Ave
- 3218 Santa Barbara Blvd N
- 3226 Santa Barbara Blvd N
- 3214 NW Juanita Place
- 3031 NE 1st Ave
- 3220 NW Juanita Place
- 3019 NW Juanita Place
- 3024 NE 2nd Ave
- 3165 Santa Barbara Blvd N
- 17041 Pleasure Rd
- 3171 Santa Barbara Blvd N
- 3065 Santa Barbara Blvd N
- 52 Jacaranda Pkwy
- 52 Jacaranda Pkwy E Unit 36
- 52 Jacaranda Pkwy E
- 58 Jacaranda Pkwy E
- 42 Jacaranda Pkwy E
- 3205 Santa Barbara Blvd N
- 17101 Pleasure Rd
- 100 Jacaranda Pkwy E
- 51 NE 31st Terrace Unit 19
- 47 NE 31st Terrace
- 34 Jacaranda Pkwy E Unit 1
- 3211 Santa Barbara Blvd N
- 101 NE 31st Terrace
- 3131 Jacaranda Pkwy
- 108 Jacaranda Pkwy Unit PKY
- 108 Jacaranda Pkwy