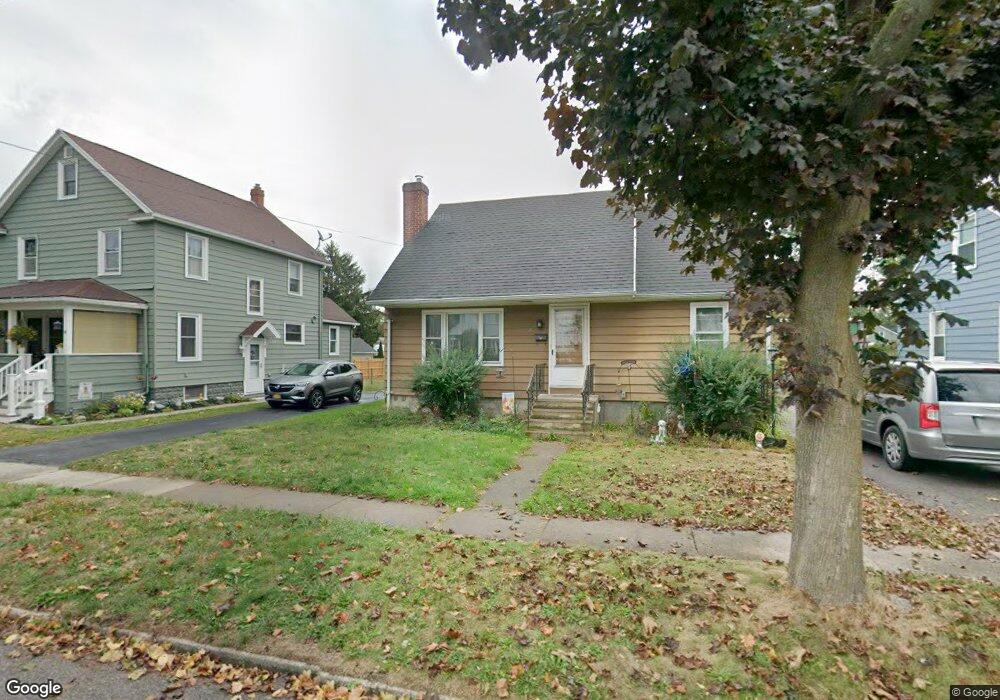
47 Otis St Batavia, NY 14020
Estimated Value: $136,000 - $182,000
3
Beds
1
Bath
1,248
Sq Ft
$136/Sq Ft
Est. Value
About This Home
This home is located at 47 Otis St, Batavia, NY 14020 and is currently estimated at $169,282, approximately $135 per square foot. 47 Otis St is a home located in Genesee County with nearby schools including Jackson Primary School, John Kennedy Intermediate School, and Batavia Middle School.
Ownership History
Date
Name
Owned For
Owner Type
Purchase Details
Closed on
Sep 13, 2017
Sold by
Pero Jeanne Rugala Execu
Bought by
Oxencis Travis
Current Estimated Value
Home Financials for this Owner
Home Financials are based on the most recent Mortgage that was taken out on this home.
Original Mortgage
$50,500
Outstanding Balance
$42,160
Interest Rate
3.89%
Mortgage Type
Purchase Money Mortgage
Estimated Equity
$127,122
Purchase Details
Closed on
Sep 16, 2005
Sold by
Rugala Arlene
Bought by
Rugala Paul
Create a Home Valuation Report for This Property
The Home Valuation Report is an in-depth analysis detailing your home's value as well as a comparison with similar homes in the area
Home Values in the Area
Average Home Value in this Area
Purchase History
| Date | Buyer | Sale Price | Title Company |
|---|---|---|---|
| Oxencis Travis | $58,000 | Thomas Williams | |
| Rugala Paul | $46,000 | Robert Balbick |
Source: Public Records
Mortgage History
| Date | Status | Borrower | Loan Amount |
|---|---|---|---|
| Open | Oxencis Travis | $50,500 |
Source: Public Records
Tax History Compared to Growth
Tax History
| Year | Tax Paid | Tax Assessment Tax Assessment Total Assessment is a certain percentage of the fair market value that is determined by local assessors to be the total taxable value of land and additions on the property. | Land | Improvement |
|---|---|---|---|---|
| 2024 | $4,165 | $128,000 | $15,000 | $113,000 |
| 2023 | $2,022 | $110,000 | $15,000 | $95,000 |
| 2022 | $3,759 | $110,000 | $15,000 | $95,000 |
| 2021 | $3,711 | $98,000 | $15,000 | $83,000 |
| 2020 | $3,380 | $85,000 | $15,000 | $70,000 |
| 2019 | $3,272 | $85,000 | $15,000 | $70,000 |
| 2018 | $3,272 | $78,000 | $10,700 | $67,300 |
| 2017 | $2,656 | $78,000 | $10,700 | $67,300 |
| 2016 | $2,696 | $78,000 | $10,700 | $67,300 |
| 2015 | -- | $78,000 | $10,700 | $67,300 |
| 2014 | -- | $78,000 | $10,700 | $67,300 |
Source: Public Records
Map
Nearby Homes