Estimated Value: $569,000 - $822,000
3
Beds
2
Baths
1,693
Sq Ft
$418/Sq Ft
Est. Value
About This Home
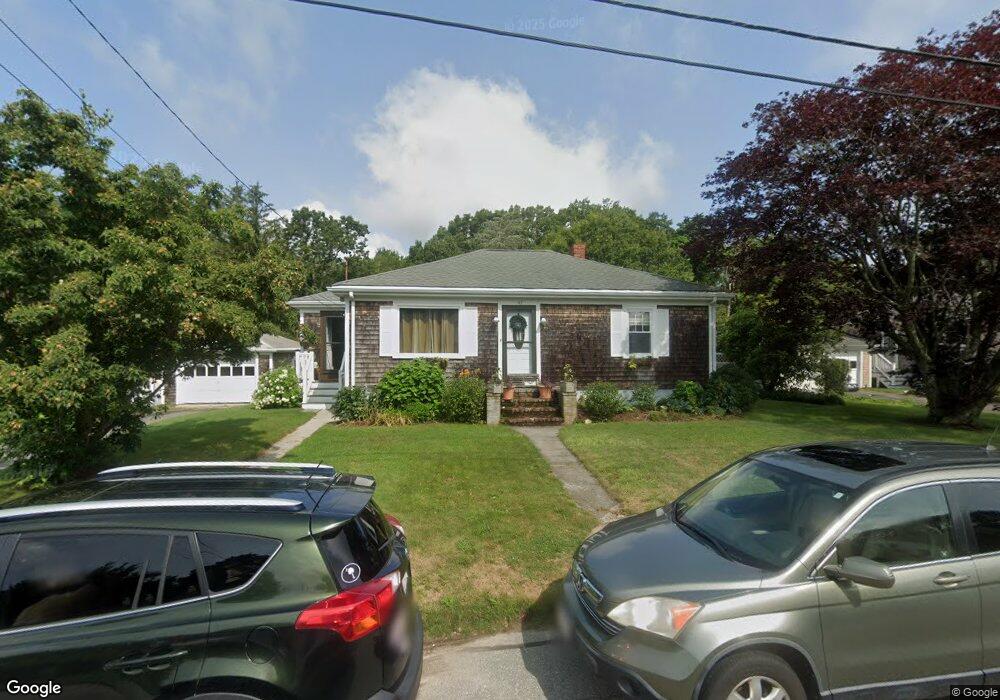
This home is located at 47 Smith St, South Dartmouth, MA 02748 and is currently estimated at $707,858, approximately $418 per square foot. 47 Smith St is a home located in Bristol County with nearby schools including Dartmouth High School and St. Teresa of Calcutta School.
Ownership History
Date
Name
Owned For
Owner Type
Purchase Details
Closed on
Jun 2, 2006
Sold by
Ventura Justin L
Bought by
Baker Amy J and Baker Sean M
Current Estimated Value
Purchase Details
Closed on
Mar 10, 2005
Sold by
Ventura Ana Isabel and Ventura Justin L
Bought by
Ventura Justin L
Purchase Details
Closed on
Jul 1, 2004
Sold by
Medeiros David and Medeiros Sonia
Bought by
Ventura Ana Isabel and Ventura Justin L
Create a Home Valuation Report for This Property
The Home Valuation Report is an in-depth analysis detailing your home's value as well as a comparison with similar homes in the area
Home Values in the Area
Average Home Value in this Area
Purchase History
| Date | Buyer | Sale Price | Title Company |
|---|---|---|---|
| Baker Amy J | $460,000 | -- | |
| Ventura Justin L | -- | -- | |
| Ventura Ana Isabel | $385,000 | -- |
Source: Public Records
Mortgage History
| Date | Status | Borrower | Loan Amount |
|---|---|---|---|
| Open | Ventura Ana Isabel | $276,000 | |
| Closed | Ventura Ana Isabel | $282,000 |
Source: Public Records
Tax History Compared to Growth
Tax History
| Year | Tax Paid | Tax Assessment Tax Assessment Total Assessment is a certain percentage of the fair market value that is determined by local assessors to be the total taxable value of land and additions on the property. | Land | Improvement |
|---|---|---|---|---|
| 2025 | $3,980 | $462,300 | $178,700 | $283,600 |
| 2024 | $3,963 | $456,000 | $178,700 | $277,300 |
| 2023 | $3,814 | $415,900 | $164,600 | $251,300 |
| 2022 | $3,715 | $375,300 | $164,600 | $210,700 |
| 2021 | $3,656 | $352,900 | $146,100 | $206,800 |
| 2020 | $3,640 | $350,700 | $153,000 | $197,700 |
| 2019 | $3,506 | $337,100 | $142,000 | $195,100 |
| 2018 | $3,240 | $315,600 | $142,000 | $173,600 |
| 2017 | $3,103 | $309,700 | $139,200 | $170,500 |
| 2016 | $3,173 | $312,300 | $152,100 | $160,200 |
| 2015 | $3,012 | $297,000 | $134,900 | $162,100 |
| 2014 | $2,958 | $289,700 | $131,100 | $158,600 |
Source: Public Records
Map
Nearby Homes