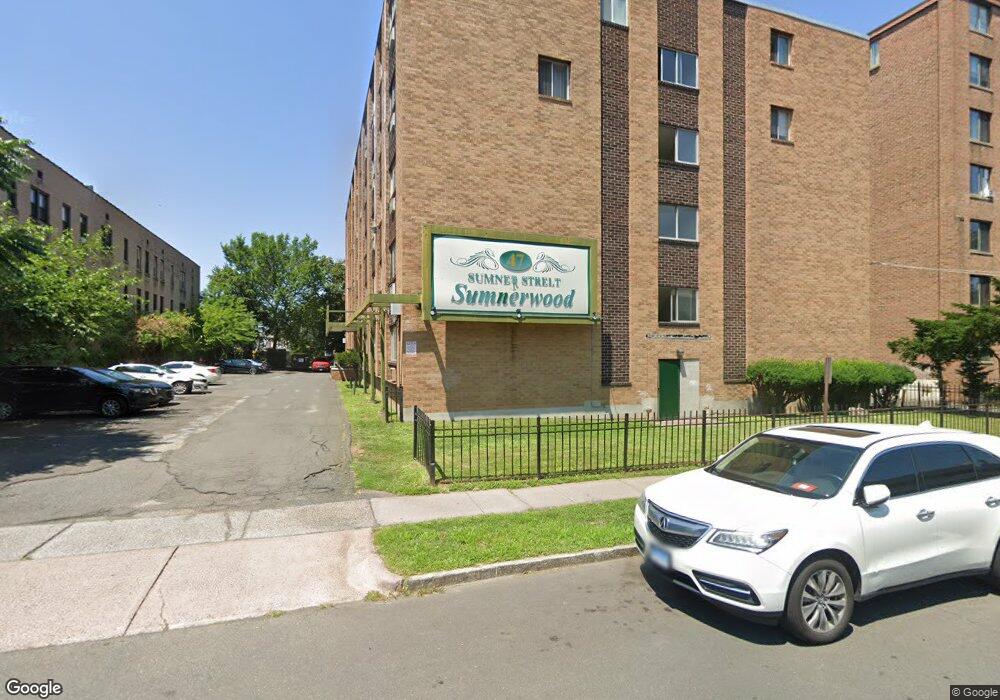
47 Sumner St Unit 402 Hartford, CT 06105
Asylum Hill NeighborhoodEstimated Value: $57,000 - $710,083
1
Bed
1
Bath
650
Sq Ft
$433/Sq Ft
Est. Value
About This Home
This home is located at 47 Sumner St Unit 402, Hartford, CT 06105 and is currently estimated at $281,694, approximately $433 per square foot. 47 Sumner St Unit 402 is a home located in Hartford County with nearby schools including Noah Webster Micro Society School, Rawson School, and McKinley School.
Ownership History
Date
Name
Owned For
Owner Type
Purchase Details
Closed on
May 6, 2024
Sold by
47 Sumner Llc
Bought by
888 Sumner Llc
Current Estimated Value
Home Financials for this Owner
Home Financials are based on the most recent Mortgage that was taken out on this home.
Original Mortgage
$800,000
Outstanding Balance
$788,024
Interest Rate
6.87%
Mortgage Type
Commercial
Estimated Equity
-$506,330
Purchase Details
Closed on
Sep 15, 2015
Sold by
Black Alvin and Black Kristina
Bought by
47 Sumner Llc
Purchase Details
Closed on
Apr 17, 2006
Sold by
Black Oliver
Bought by
Black Alvin
Home Financials for this Owner
Home Financials are based on the most recent Mortgage that was taken out on this home.
Original Mortgage
$25,000
Interest Rate
6.28%
Purchase Details
Closed on
Aug 15, 1997
Sold by
Gould David and Gould Viginia
Bought by
Black Patrick
Home Financials for this Owner
Home Financials are based on the most recent Mortgage that was taken out on this home.
Original Mortgage
$12,000
Interest Rate
7.56%
Mortgage Type
Unknown
Create a Home Valuation Report for This Property
The Home Valuation Report is an in-depth analysis detailing your home's value as well as a comparison with similar homes in the area
Home Values in the Area
Average Home Value in this Area
Purchase History
| Date | Buyer | Sale Price | Title Company |
|---|---|---|---|
| 888 Sumner Llc | $800,000 | None Available | |
| 47 Sumner Llc | $325,000 | -- | |
| Black Alvin | $30,000 | -- | |
| Black Patrick | $4,100 | -- |
Source: Public Records
Mortgage History
| Date | Status | Borrower | Loan Amount |
|---|---|---|---|
| Open | 888 Sumner Llc | $800,000 | |
| Previous Owner | Black Patrick | $25,000 | |
| Previous Owner | Black Patrick | $12,000 |
Source: Public Records
Tax History Compared to Growth
Tax History
| Year | Tax Paid | Tax Assessment Tax Assessment Total Assessment is a certain percentage of the fair market value that is determined by local assessors to be the total taxable value of land and additions on the property. | Land | Improvement |
|---|---|---|---|---|
| 2025 | $634 | $9,188 | $0 | $9,188 |
| 2024 | $634 | $9,188 | $0 | $9,188 |
| 2023 | $634 | $9,188 | $0 | $9,188 |
| 2022 | $512 | $9,188 | $0 | $9,188 |
| 2021 | $512 | $6,895 | $0 | $6,895 |
| 2020 | $512 | $6,895 | $0 | $6,895 |
| 2019 | $512 | $6,895 | $0 | $6,895 |
| 2018 | $495 | $6,663 | $0 | $6,663 |
| 2016 | $495 | $6,667 | $0 | $6,667 |
| 2015 | $472 | $6,351 | $0 | $6,351 |
| 2014 | $460 | $6,196 | $0 | $6,196 |
Source: Public Records
Map
Nearby Homes
- 251 Collins St
- 33 Sargeant St
- 16 Townley St Unit G3
- 96 Sargeant St Unit 98
- 25 May St
- 232 Farmington Ave Unit D8
- 235 Farmington Ave Unit A
- 52 Atwood St Unit 3B
- 237 Farmington Ave Unit B
- 71A Imlay St Unit D2
- 337 Laurel St
- 10 Burton St Unit 12
- 240 Sargeant St
- 11 Marshall St
- 300 Garden St
- 47 Williams St Unit 49
- 59 Magnolia St
- 62 Burton St
- 290 Sargeant St Unit 292
- 202 Laurel St
- 47 Sumner St Unit 508
- 47 Sumner St Unit 507
- 47 Sumner St Unit 506
- 47 Sumner St Unit 505
- 47 Sumner St Unit 504
- 47 Sumner St Unit 503
- 47 Sumner St Unit 502
- 47 Sumner St Unit 501
- 47 Sumner St Unit 409
- 47 Sumner St Unit 408
- 47 Sumner St Unit 407
- 47 Sumner St Unit 406
- 47 Sumner St Unit 405
- 47 Sumner St Unit 404
- 47 Sumner St Unit 403
- 47 Sumner St Unit 401
- 47 Sumner St Unit 308
- 47 Sumner St Unit 307
- 47 Sumner St Unit 306
- 47 Sumner St Unit 305