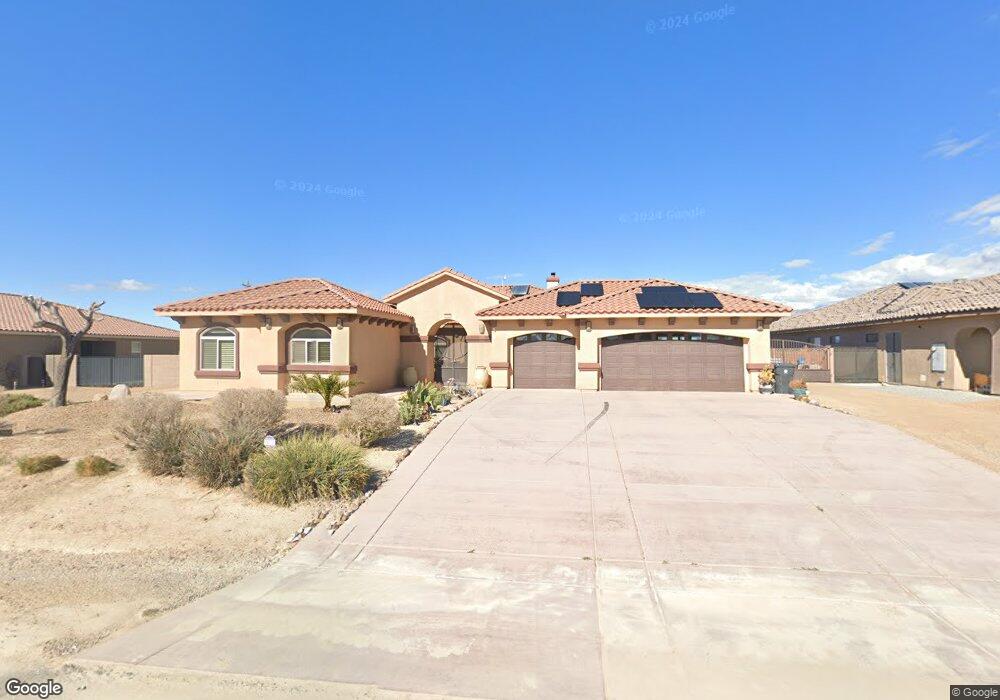
4700 Westmont Ave Pahrump, NV 89061
Estimated Value: $501,000 - $571,000
--
Bed
--
Bath
2,512
Sq Ft
$216/Sq Ft
Est. Value
About This Home
This home is located at 4700 Westmont Ave, Pahrump, NV 89061 and is currently estimated at $543,338, approximately $216 per square foot. 4700 Westmont Ave is a home located in Nye County with nearby schools including Floyd Elementary School, Rosemary Clarke Middle School, and Pahrump Valley High School.
Ownership History
Date
Name
Owned For
Owner Type
Purchase Details
Closed on
Apr 4, 2013
Sold by
Boyd Dennis R and Boyd Mary E
Bought by
Cox Michael and Cox Wendy Lou
Current Estimated Value
Purchase Details
Closed on
Apr 1, 2009
Sold by
Federal National Mortgage Association
Bought by
Boyd Dennis R and Boyd Mary E
Home Financials for this Owner
Home Financials are based on the most recent Mortgage that was taken out on this home.
Original Mortgage
$160,000
Interest Rate
5.04%
Mortgage Type
Purchase Money Mortgage
Purchase Details
Closed on
Nov 13, 2008
Sold by
Moore David P and Moore Rosa A
Bought by
Federal National Mortgage Association
Purchase Details
Closed on
May 17, 2006
Sold by
Hafen Ranch Estates Inc
Bought by
Moore David P and Moore Rosa A
Home Financials for this Owner
Home Financials are based on the most recent Mortgage that was taken out on this home.
Original Mortgage
$86,700
Interest Rate
6.55%
Mortgage Type
Seller Take Back
Create a Home Valuation Report for This Property
The Home Valuation Report is an in-depth analysis detailing your home's value as well as a comparison with similar homes in the area
Home Values in the Area
Average Home Value in this Area
Purchase History
| Date | Buyer | Sale Price | Title Company |
|---|---|---|---|
| Cox Michael | $299,500 | First American Title | |
| Boyd Dennis R | $210,000 | Lawyers Title Of Nevada | |
| Federal National Mortgage Association | $362,196 | First American Title Ins Co | |
| Moore David P | $102,000 | Multiple |
Source: Public Records
Mortgage History
| Date | Status | Borrower | Loan Amount |
|---|---|---|---|
| Previous Owner | Boyd Dennis R | $160,000 | |
| Previous Owner | Moore David P | $86,700 |
Source: Public Records
Tax History Compared to Growth
Tax History
| Year | Tax Paid | Tax Assessment Tax Assessment Total Assessment is a certain percentage of the fair market value that is determined by local assessors to be the total taxable value of land and additions on the property. | Land | Improvement |
|---|---|---|---|---|
| 2025 | $3,347 | $181,065 | $14,026 | $167,039 |
| 2024 | $3,347 | $177,907 | $8,875 | $169,032 |
| 2023 | $3,347 | $164,109 | $8,875 | $155,234 |
| 2022 | $3,154 | $148,026 | $6,339 | $141,687 |
| 2021 | $3,065 | $141,400 | $5,071 | $136,329 |
| 2020 | $2,977 | $141,147 | $5,071 | $136,076 |
| 2019 | $2,890 | $168,837 | $5,071 | $163,766 |
| 2018 | $2,807 | $162,400 | $4,057 | $158,343 |
| 2017 | $2,726 | $130,139 | $4,057 | $126,082 |
| 2016 | $2,658 | $92,163 | $4,057 | $88,106 |
| 2015 | $2,653 | $85,239 | $4,057 | $81,182 |
| 2014 | $2,577 | $92,205 | $4,057 | $88,148 |
Source: Public Records
Map
Nearby Homes
- 4680 Peppertree St
- 6431 Sundance St
- 5060 Wheatland Dr
- 6440 Montclair St
- 4721 E Sandalwood Dr
- 6300 Jane Ave
- 4911 E Parkwood Dr
- 3750 Mary Lou St
- 3930 Mary Lou St
- 4960 Honey Locust Dr
- 3600 E Bridger St
- 4301 E Bridger St
- 4851 Marywood Ct
- 6650 Southgate St
- 4281 Susquehanna St
- 5170 Fairmont St
- 5331 Deerfield Ct
- 5980 Santovito St
- 5220 Chasemoor St
- 5351 Fieldstone Dr
- 4700 Westmont Dr
- 4720 Westmont Ave
- 4680 Westmont Dr
- 4720 Westmont Dr
- 6240 Barberry Ct
- 4660 Westmont Dr
- 4661 Westmont Ave
- 6260 Barberry Ct
- 4741 Westmont Dr
- 4700 Peppertree St
- 4640 Westmont Dr
- 4720 Peppertree St
- 4641 E Westmont Dr
- 4641 Westmont Dr
- 4660 Peppertree St
- 4761 Westmont Dr
- 4761 Westmont Dr
- 6280 Barberry Ct
- 6220 S Fox Ave
- 4620 Westmont Dr