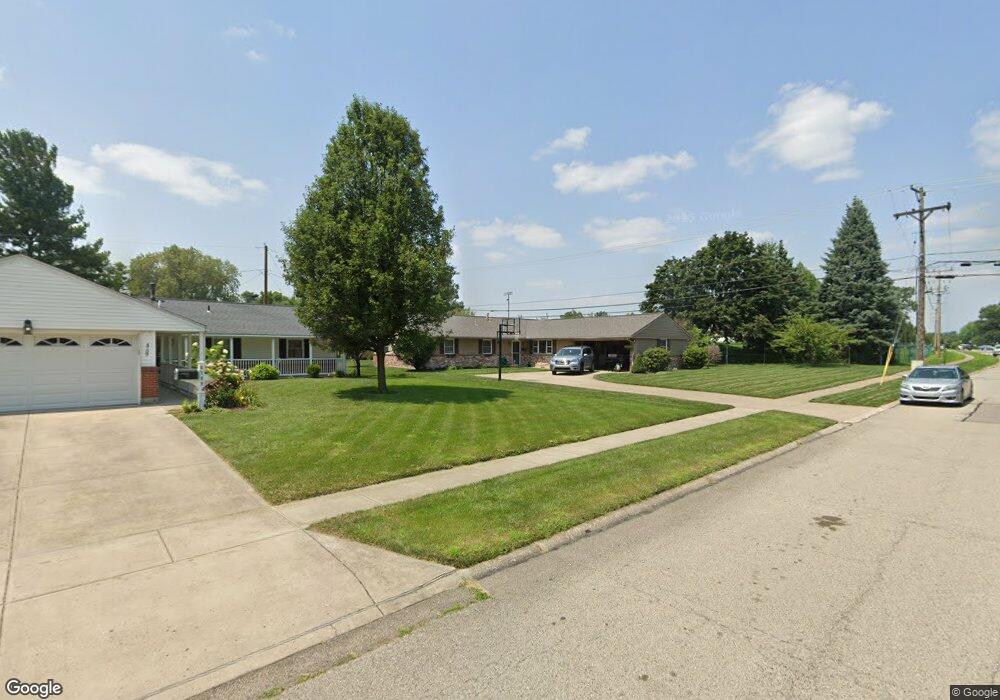
4701 Renwood Dr Dayton, OH 45429
Estimated Value: $276,419 - $310,000
3
Beds
2
Baths
1,617
Sq Ft
$180/Sq Ft
Est. Value
About This Home
This home is located at 4701 Renwood Dr, Dayton, OH 45429 and is currently estimated at $291,605, approximately $180 per square foot. 4701 Renwood Dr is a home located in Montgomery County with nearby schools including John F. Kennedy Elementary School, Kettering Middle School, and Kettering Fairmont High School.
Ownership History
Date
Name
Owned For
Owner Type
Purchase Details
Closed on
Jul 29, 2016
Sold by
Santoianni Diana K and Santoianni Justine L
Bought by
Brothers Daniel and Brothers Aisha
Current Estimated Value
Home Financials for this Owner
Home Financials are based on the most recent Mortgage that was taken out on this home.
Original Mortgage
$173,552
Outstanding Balance
$138,831
Interest Rate
3.56%
Mortgage Type
VA
Estimated Equity
$152,774
Purchase Details
Closed on
Oct 14, 2011
Sold by
Drickx John H and Dirckx Joyce
Bought by
Santoianni Diana K
Home Financials for this Owner
Home Financials are based on the most recent Mortgage that was taken out on this home.
Original Mortgage
$82,845
Interest Rate
4.25%
Mortgage Type
FHA
Purchase Details
Closed on
Dec 9, 2010
Sold by
Estate Of Charles D Dirckx
Bought by
Dirckx John H
Create a Home Valuation Report for This Property
The Home Valuation Report is an in-depth analysis detailing your home's value as well as a comparison with similar homes in the area
Home Values in the Area
Average Home Value in this Area
Purchase History
| Date | Buyer | Sale Price | Title Company |
|---|---|---|---|
| Brothers Daniel | $169,900 | Fidelity Lawyers Title Agenc | |
| Santoianni Diana K | $85,000 | Attorney | |
| Dirckx John H | -- | Attorney |
Source: Public Records
Mortgage History
| Date | Status | Borrower | Loan Amount |
|---|---|---|---|
| Open | Brothers Daniel | $173,552 | |
| Previous Owner | Santoianni Diana K | $82,845 |
Source: Public Records
Tax History Compared to Growth
Tax History
| Year | Tax Paid | Tax Assessment Tax Assessment Total Assessment is a certain percentage of the fair market value that is determined by local assessors to be the total taxable value of land and additions on the property. | Land | Improvement |
|---|---|---|---|---|
| 2024 | $4,453 | $71,840 | $12,100 | $59,740 |
| 2023 | $4,453 | $71,840 | $12,100 | $59,740 |
| 2022 | $4,277 | $54,560 | $9,160 | $45,400 |
| 2021 | $3,955 | $54,560 | $9,160 | $45,400 |
| 2020 | $3,967 | $54,560 | $9,160 | $45,400 |
| 2019 | $3,895 | $47,360 | $9,160 | $38,200 |
| 2018 | $3,916 | $47,360 | $9,160 | $38,200 |
| 2017 | $3,606 | $47,360 | $9,160 | $38,200 |
| 2016 | $3,615 | $44,610 | $9,160 | $35,450 |
| 2015 | $3,453 | $44,610 | $9,160 | $35,450 |
| 2014 | $3,453 | $44,610 | $9,160 | $35,450 |
| 2012 | -- | $44,590 | $10,120 | $34,470 |
Source: Public Records
Map
Nearby Homes
- 1049 Georgian Dr
- 4817 Ackerman Blvd
- 4640 Marshall Rd
- 1008 Rio Ln
- 1033 Carlo Dr
- 5017 Ackerman Blvd
- 1310 Partridge Run Cir Unit 1310
- 617 Laurelann Dr
- 804 Lovetta Dr
- 730 Hyde Park Dr
- 5155 Marshall Rd
- 321 Princewood Ave
- 501 Judith Dr
- 1328 Willowdale Ave
- 791 Willowdale Ave
- 1013 Swango Dr
- 4307 Meadowcroft Rd
- 4816 Judith Dr
- 4808 Judith Dr
- 959 Kimberly Dr
- 4709 Renwood Dr
- 4708 Highgate Dr
- 4717 Renwood Dr
- 4700 Highgate Dr
- 4650 Renwood Dr
- 4700 Renwood Dr
- 4708 Renwood Dr
- 4716 Highgate Dr
- 4725 Renwood Dr
- 4716 Renwood Dr
- 4724 Highgate Dr
- 4724 Renwood Dr
- 4616 Renwood Dr
- 1059 Pepper Hill Dr
- 4709 Highgate Dr
- 1051 Pepper Hill Dr
- 1075 Pepper Hill Dr
- 4717 Highgate Dr
- 4608 Renwood Dr
- 4725 Highgate Dr