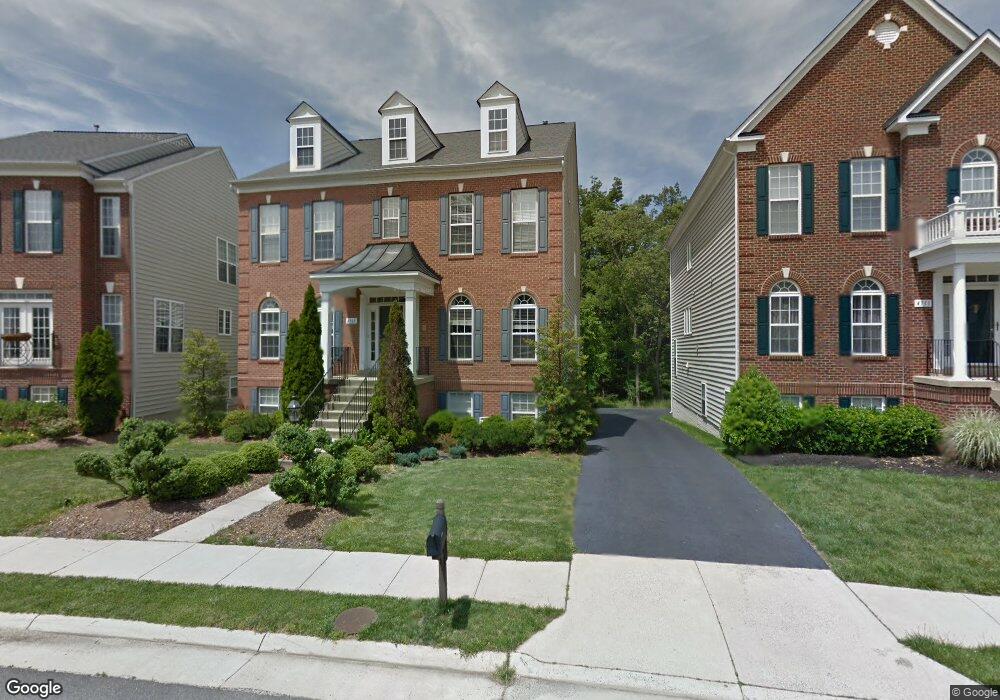
4709 Cochran Place Centreville, VA 20120
Estimated Value: $1,158,000 - $1,268,000
5
Beds
5
Baths
3,656
Sq Ft
$328/Sq Ft
Est. Value
About This Home
This home is located at 4709 Cochran Place, Centreville, VA 20120 and is currently estimated at $1,199,309, approximately $328 per square foot. 4709 Cochran Place is a home located in Fairfax County with nearby schools including Greenbriar West Elementary School, Rocky Run Middle School, and Chantilly High School.
Ownership History
Date
Name
Owned For
Owner Type
Purchase Details
Closed on
Mar 24, 2006
Sold by
Sirva Relocation Credit L
Bought by
Choi Jeho and Kim,You Sun
Current Estimated Value
Home Financials for this Owner
Home Financials are based on the most recent Mortgage that was taken out on this home.
Original Mortgage
$652,500
Outstanding Balance
$371,158
Interest Rate
6.28%
Mortgage Type
New Conventional
Estimated Equity
$828,151
Purchase Details
Closed on
Dec 28, 2005
Sold by
Cunningham Thomas R
Bought by
Sirva Relocation Credit Llc
Purchase Details
Closed on
Nov 25, 2003
Sold by
Centex Homes
Bought by
Cunningham Thomas R
Home Financials for this Owner
Home Financials are based on the most recent Mortgage that was taken out on this home.
Original Mortgage
$559,900
Interest Rate
5.98%
Mortgage Type
New Conventional
Create a Home Valuation Report for This Property
The Home Valuation Report is an in-depth analysis detailing your home's value as well as a comparison with similar homes in the area
Home Values in the Area
Average Home Value in this Area
Purchase History
| Date | Buyer | Sale Price | Title Company |
|---|---|---|---|
| Choi Jeho | $870,000 | -- | |
| Sirva Relocation Credit Llc | $897,500 | -- | |
| Cunningham Thomas R | $399,900 | -- |
Source: Public Records
Mortgage History
| Date | Status | Borrower | Loan Amount |
|---|---|---|---|
| Open | Choi Jeho | $652,500 | |
| Previous Owner | Cunningham Thomas R | $559,900 |
Source: Public Records
Tax History Compared to Growth
Tax History
| Year | Tax Paid | Tax Assessment Tax Assessment Total Assessment is a certain percentage of the fair market value that is determined by local assessors to be the total taxable value of land and additions on the property. | Land | Improvement |
|---|---|---|---|---|
| 2025 | $12,268 | $1,058,940 | $308,000 | $750,940 |
| 2024 | $12,268 | $1,058,940 | $308,000 | $750,940 |
| 2023 | $11,221 | $994,310 | $298,000 | $696,310 |
| 2022 | $10,716 | $937,090 | $263,000 | $674,090 |
| 2021 | $9,626 | $820,300 | $253,000 | $567,300 |
| 2020 | $9,298 | $785,630 | $243,000 | $542,630 |
| 2019 | $9,136 | $771,970 | $233,000 | $538,970 |
| 2018 | $8,664 | $753,420 | $230,000 | $523,420 |
| 2017 | $8,489 | $731,170 | $223,000 | $508,170 |
| 2016 | $8,471 | $731,170 | $223,000 | $508,170 |
| 2015 | $8,082 | $724,160 | $223,000 | $501,160 |
| 2014 | $7,657 | $687,670 | $218,000 | $469,670 |
Source: Public Records
Map
Nearby Homes
- 4828 Heron Neck Ln
- 4417 Fair Stone Dr Unit 104
- 4413 Fair Stone Dr Unit 306
- 13329 Connor Dr Unit B
- 13363 Connor Dr Unit I
- 13369 Connor Dr
- 5126 Brittney Elyse Cir Unit A
- 5019 Village Fountain Place
- 13386 Connor Dr Unit D
- 13611 British Manor Ct
- 5123 Travis Edward Way Unit B
- 5096 Village Fountain Place
- 5209 Jule Star Dr
- 5280 Jule Star Dr
- 4511 Stone Pine Ct
- 5459 Serviceberry St
- 4503 Stone Pine Ct
- 4427 Majestic Ln
- 4506 Superior Square
- 4528 Superior Square
- 4707 Cochran Place
- 4711 Cochran Place
- 4705 Cochran Place
- 4713 Cochran Place
- 4710 Cochran Place
- 4715 Cochran Place
- 4703 Cochran Place
- 4712 Cochran Place
- 4717 Cochran Place
- 4701 Cochran Place
- 4702 Cochran Place
- 4714 Cochran Place
- 4719 Cochran Place
- 4969 Marshall Crown Rd
- 4971 Marshall Crown Rd
- 4721 Cochran Place
- 4718 Cochran Place
- 13288 Scotch Run Ct
- 4723 Cochran Place
- 4973 Marshall Crown Rd