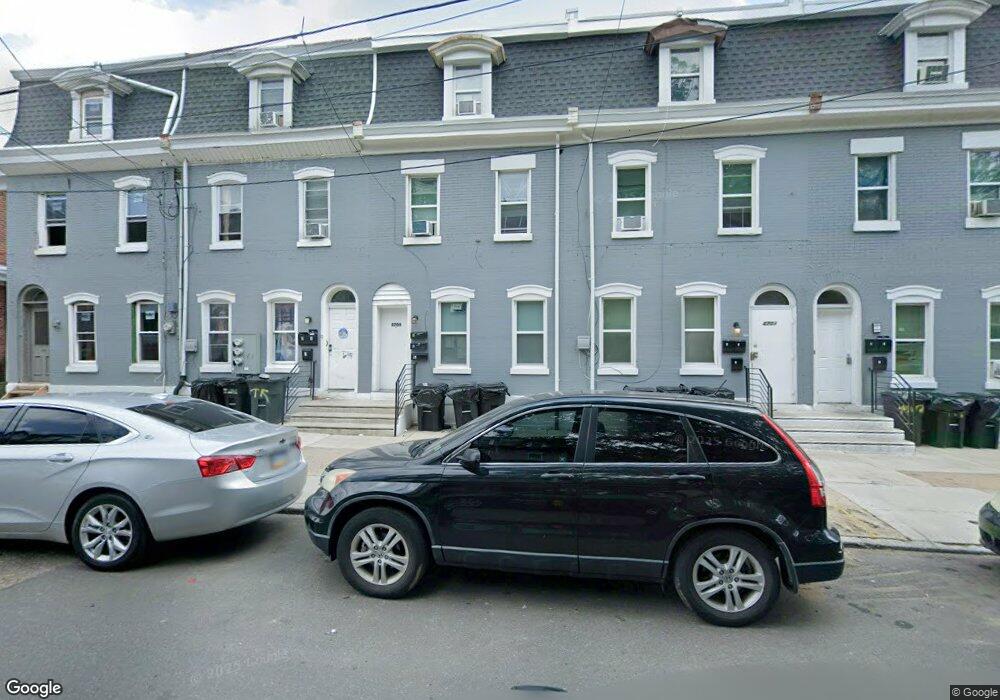
4709 Penn St Philadelphia, PA 19124
Frankford NeighborhoodEstimated Value: $175,000
3
Beds
2
Baths
2,090
Sq Ft
$84/Sq Ft
Est. Value
About This Home
This home is located at 4709 Penn St, Philadelphia, PA 19124 and is currently estimated at $175,000, approximately $83 per square foot. 4709 Penn St is a home located in Philadelphia County with nearby schools including John Marshall School, Harding Warren G Middle School, and Frankford High School.
Ownership History
Date
Name
Owned For
Owner Type
Purchase Details
Closed on
Sep 21, 2021
Sold by
Tri-Stone Capital Llc
Bought by
Frankford Partners 3 Lp
Current Estimated Value
Home Financials for this Owner
Home Financials are based on the most recent Mortgage that was taken out on this home.
Original Mortgage
$607,500
Interest Rate
3.45%
Mortgage Type
Construction
Purchase Details
Closed on
Jan 7, 2010
Sold by
United Capital Funding Group Llc
Bought by
Tri Stone Capital Llc
Home Financials for this Owner
Home Financials are based on the most recent Mortgage that was taken out on this home.
Original Mortgage
$1,018,320
Interest Rate
4.46%
Mortgage Type
Future Advance Clause Open End Mortgage
Purchase Details
Closed on
Dec 10, 2009
Sold by
Treacy Michael J and Treacy Debra R
Bought by
United Capital Funding Group Llc
Home Financials for this Owner
Home Financials are based on the most recent Mortgage that was taken out on this home.
Original Mortgage
$1,018,320
Interest Rate
4.46%
Mortgage Type
Future Advance Clause Open End Mortgage
Purchase Details
Closed on
Sep 10, 1987
Sold by
Treacy Michael J and Treacy Debra R
Bought by
Treacy Michael J and Treacy Debra R
Create a Home Valuation Report for This Property
The Home Valuation Report is an in-depth analysis detailing your home's value as well as a comparison with similar homes in the area
Home Values in the Area
Average Home Value in this Area
Purchase History
| Date | Buyer | Sale Price | Title Company |
|---|---|---|---|
| Frankford Partners 3 Lp | $140,000 | None Listed On Document | |
| Tri Stone Capital Llc | $32,552 | None Available | |
| United Capital Funding Group Llc | $70,000 | None Available | |
| Treacy Michael J | -- | -- |
Source: Public Records
Mortgage History
| Date | Status | Borrower | Loan Amount |
|---|---|---|---|
| Previous Owner | Frankford Partners 3 Lp | $607,500 | |
| Previous Owner | Tri Stone Capital Llc | $1,018,320 | |
| Previous Owner | United Capital Funding Group Llc | $49,000 |
Source: Public Records
Tax History Compared to Growth
Tax History
| Year | Tax Paid | Tax Assessment Tax Assessment Total Assessment is a certain percentage of the fair market value that is determined by local assessors to be the total taxable value of land and additions on the property. | Land | Improvement |
|---|---|---|---|---|
| 2026 | $2,791 | $374,000 | $74,800 | $299,200 |
| 2025 | $2,791 | $374,000 | $74,800 | $299,200 |
| 2024 | $2,791 | $374,000 | $74,800 | $299,200 |
| 2023 | $2,791 | $199,400 | $39,880 | $159,520 |
| 2022 | $1,172 | $199,400 | $39,880 | $159,520 |
| 2021 | $1,172 | $0 | $0 | $0 |
| 2020 | $1,172 | $0 | $0 | $0 |
| 2019 | $1,124 | $0 | $0 | $0 |
| 2018 | $1,330 | $0 | $0 | $0 |
| 2017 | $1,592 | $0 | $0 | $0 |
| 2016 | $1,592 | $0 | $0 | $0 |
| 2015 | $1,524 | $0 | $0 | $0 |
| 2014 | -- | $113,700 | $18,775 | $94,925 |
| 2012 | -- | $10,400 | $1,338 | $9,062 |
Source: Public Records
Map
Nearby Homes
- 4712 Griscom St
- 4720 Penn St
- 1516 Arrott St
- 4665 Leiper St
- 4734 44 Oxford Ave
- 1515 Foulkrod St
- 1519 Foulkrod St
- 1518 Overington St
- 4735 Frankford Ave
- 4814 Griscom St
- 1626 Margaret St
- 4839 Griscom St
- 1636 Margaret St
- 1629 Foulkrod St
- 1615 Fillmore St
- 4628 Pilling St
- 1335 Fillmore St
- 4626 Pilling St
- 1636 Fillmore St
- 4925 Penn St
- 4711 Penn St Unit First Floor - A1
- 4711 Penn St Unit B2
- 4711 Penn St Unit A3
- 4711 Penn St
- 4707 Penn St
- 4705 Penn St
- 4713 Penn St
- 4703 Penn St Unit 3rd Floor C
- 4703 Penn St
- 4715 Penn St
- 4701 Penn St
- 1511 Arrott St
- 4717 Penn St
- 1513 Arrott St
- 4719 Penn St
- 1515 Arrott St
- 1517 Arrott St
- 4721 Penn St
- 4708 Penn St Unit 1
- 4708 Penn St