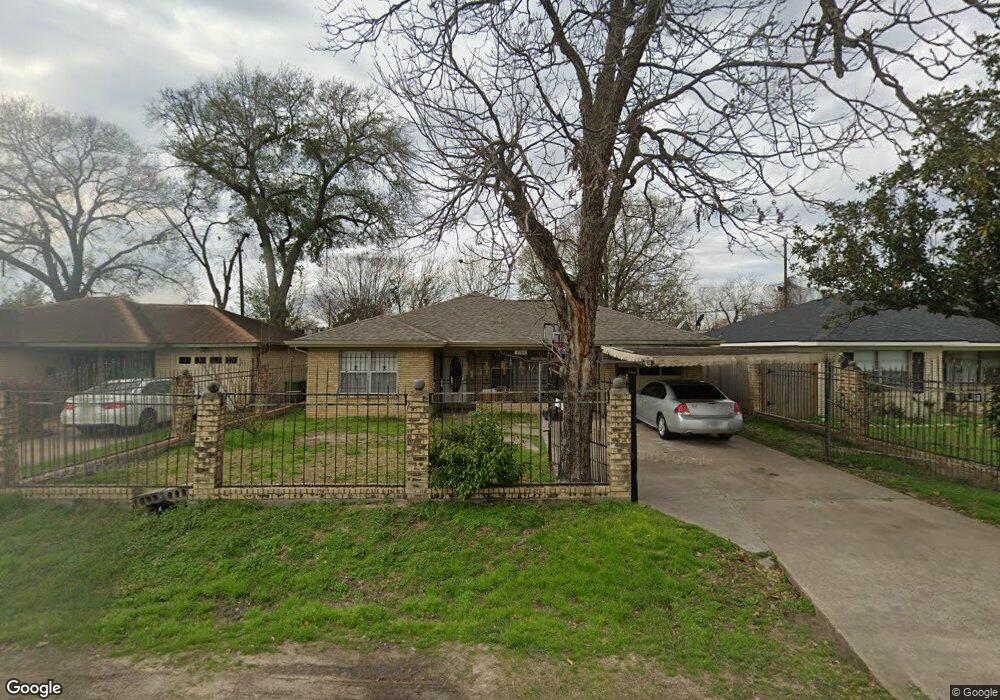
4711 Moore St Houston, TX 77009
Northside Village NeighborhoodEstimated Value: $245,000 - $357,000
2
Beds
1
Bath
1,090
Sq Ft
$281/Sq Ft
Est. Value
About This Home
This home is located at 4711 Moore St, Houston, TX 77009 and is currently estimated at $306,715, approximately $281 per square foot. 4711 Moore St is a home located in Harris County with nearby schools including Looscan Elementary School, Marshall Middle, and Northside High School.
Ownership History
Date
Name
Owned For
Owner Type
Purchase Details
Closed on
Jun 30, 2023
Sold by
Arzola Elda
Bought by
Villalpando Karina
Current Estimated Value
Home Financials for this Owner
Home Financials are based on the most recent Mortgage that was taken out on this home.
Original Mortgage
$193,500
Outstanding Balance
$188,120
Interest Rate
6.39%
Mortgage Type
New Conventional
Estimated Equity
$118,595
Purchase Details
Closed on
May 1, 2002
Sold by
Villalpando Armando and Villalpando Elda
Bought by
Villalpando Elda
Purchase Details
Closed on
Sep 10, 1997
Sold by
Eckburg Kimberly Ann and Eckburg Craig
Bought by
Villalpando Armando and Villalpando Elda
Home Financials for this Owner
Home Financials are based on the most recent Mortgage that was taken out on this home.
Original Mortgage
$330,000
Interest Rate
7.34%
Purchase Details
Closed on
Jun 5, 1997
Sold by
Burns Larry R and Burns Clyde V
Bought by
Eckberg Kimberly Ann
Create a Home Valuation Report for This Property
The Home Valuation Report is an in-depth analysis detailing your home's value as well as a comparison with similar homes in the area
Home Values in the Area
Average Home Value in this Area
Purchase History
| Date | Buyer | Sale Price | Title Company |
|---|---|---|---|
| Villalpando Karina | -- | None Listed On Document | |
| Villalpando Elda | -- | -- | |
| Villalpando Armando | -- | Texas American Title Company | |
| Eckberg Kimberly Ann | -- | -- |
Source: Public Records
Mortgage History
| Date | Status | Borrower | Loan Amount |
|---|---|---|---|
| Open | Villalpando Karina | $193,500 | |
| Previous Owner | Villalpando Armando | $330,000 |
Source: Public Records
Tax History Compared to Growth
Tax History
| Year | Tax Paid | Tax Assessment Tax Assessment Total Assessment is a certain percentage of the fair market value that is determined by local assessors to be the total taxable value of land and additions on the property. | Land | Improvement |
|---|---|---|---|---|
| 2025 | $6,517 | $305,414 | $218,103 | $87,311 |
| 2024 | $6,517 | $311,456 | $222,351 | $89,105 |
| 2023 | $6,517 | $311,456 | $222,351 | $89,105 |
| 2022 | $4,834 | $266,067 | $178,448 | $87,619 |
| 2021 | $4,652 | $199,600 | $118,965 | $80,635 |
| 2020 | $4,755 | $202,524 | $118,965 | $83,559 |
| 2019 | $4,517 | $196,859 | $113,300 | $83,559 |
| 2018 | $3,000 | $162,285 | $86,391 | $75,894 |
| 2017 | $4,103 | $162,285 | $86,391 | $75,894 |
| 2016 | $3,908 | $154,552 | $79,310 | $75,242 |
| 2015 | $1,775 | $133,444 | $56,650 | $76,794 |
| 2014 | $1,775 | $94,549 | $25,493 | $69,056 |
Source: Public Records
Map
Nearby Homes
- 4607 Cetti St
- 4803 Elser St
- 0 Frawley St
- 4614 Robertson St
- 1105 Evelyn St
- 1009 Canadian St
- 4508 Robertson St
- 1415 & 1417 Amundsen St
- 1105 Amundsen St
- 1017 Canadian St
- 4504 Robertson St
- 1109 Moody St
- 4331 Cetti St
- 4718 Averill St
- 4909 Cochran St Unit 1
- 4814 Cochran St
- 4816 Cochran St
- 612 Gale St
- 4327 Robertson St
- 1106 Weiss St