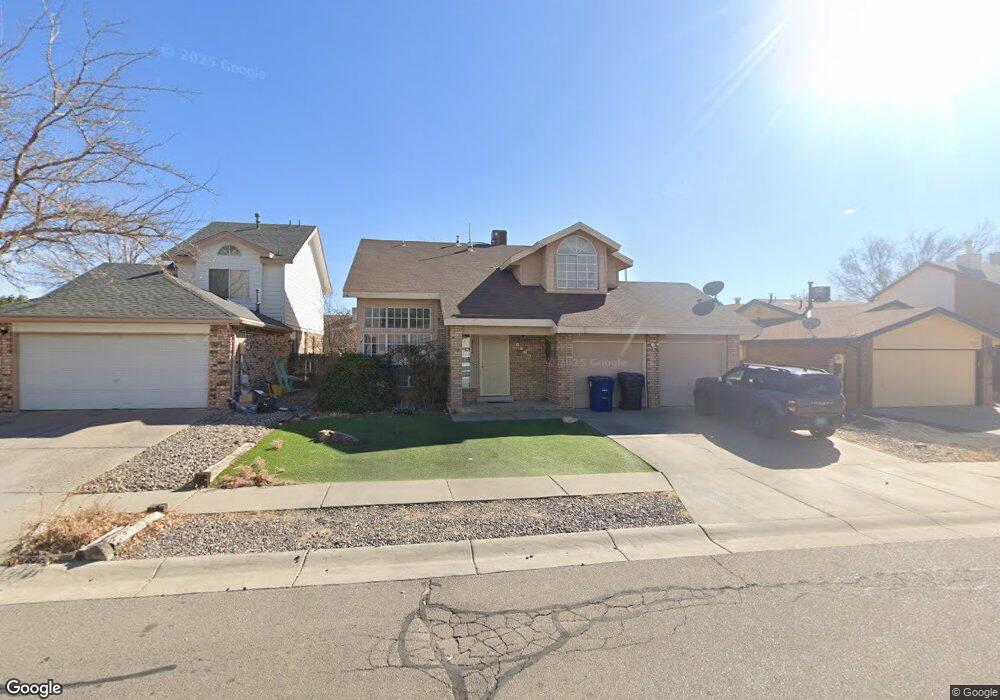
4716 Galleta Rd NW Albuquerque, NM 87120
Taylor Ranch NeighborhoodEstimated Value: $337,000 - $369,000
3
Beds
3
Baths
1,745
Sq Ft
$202/Sq Ft
Est. Value
About This Home
This home is located at 4716 Galleta Rd NW, Albuquerque, NM 87120 and is currently estimated at $352,869, approximately $202 per square foot. 4716 Galleta Rd NW is a home located in Bernalillo County with nearby schools including Chamiza Elementary School, L.B. Johnson Middle School, and Volcano Vista High School.
Ownership History
Date
Name
Owned For
Owner Type
Purchase Details
Closed on
Oct 15, 2009
Sold by
Desert State Life Management and Ristucci Carol K
Bought by
Casaus Andrea E
Current Estimated Value
Home Financials for this Owner
Home Financials are based on the most recent Mortgage that was taken out on this home.
Original Mortgage
$164,465
Outstanding Balance
$107,503
Interest Rate
5.1%
Mortgage Type
FHA
Estimated Equity
$245,366
Purchase Details
Closed on
Sep 22, 2009
Sold by
Bowker Tom and Ristucci Carol K
Bought by
Desert State Life Management
Home Financials for this Owner
Home Financials are based on the most recent Mortgage that was taken out on this home.
Original Mortgage
$164,465
Outstanding Balance
$107,503
Interest Rate
5.1%
Mortgage Type
FHA
Estimated Equity
$245,366
Purchase Details
Closed on
Jun 23, 2000
Sold by
Ristucci Joseph F
Bought by
Bowker Tom and Ristucci Carol K
Create a Home Valuation Report for This Property
The Home Valuation Report is an in-depth analysis detailing your home's value as well as a comparison with similar homes in the area
Home Values in the Area
Average Home Value in this Area
Purchase History
| Date | Buyer | Sale Price | Title Company |
|---|---|---|---|
| Casaus Andrea E | -- | Stewart Title | |
| Desert State Life Management | -- | None Available | |
| Bowker Tom | -- | -- |
Source: Public Records
Mortgage History
| Date | Status | Borrower | Loan Amount |
|---|---|---|---|
| Open | Casaus Andrea E | $164,465 |
Source: Public Records
Tax History Compared to Growth
Tax History
| Year | Tax Paid | Tax Assessment Tax Assessment Total Assessment is a certain percentage of the fair market value that is determined by local assessors to be the total taxable value of land and additions on the property. | Land | Improvement |
|---|---|---|---|---|
| 2025 | $2,826 | $68,978 | $14,780 | $54,198 |
| 2024 | $2,826 | $66,969 | $14,350 | $52,619 |
| 2023 | $2,778 | $65,019 | $13,932 | $51,087 |
| 2022 | $2,685 | $63,125 | $13,526 | $49,599 |
| 2021 | $2,595 | $61,287 | $13,132 | $48,155 |
| 2020 | $2,552 | $59,502 | $12,750 | $46,752 |
| 2019 | $2,477 | $57,769 | $12,379 | $45,390 |
| 2018 | $2,389 | $57,769 | $12,379 | $45,390 |
| 2017 | $2,316 | $56,087 | $12,018 | $44,069 |
| 2016 | $2,249 | $52,868 | $11,329 | $41,539 |
| 2015 | $51,328 | $51,328 | $10,999 | $40,329 |
| 2014 | $2,180 | $51,328 | $10,999 | $40,329 |
| 2013 | -- | $51,328 | $10,999 | $40,329 |
Source: Public Records
Map
Nearby Homes
- 4736 Galleta Rd NW
- 4612 Lobelia Rd NW
- 4500 Samara Rd NW
- 7432 Primrose Dr NW
- 6921 El Cajon Ct NW
- 7434 Riverton Dr NW
- 7516 Wells Fargo Trail NW
- 6212 Prairie Sage Dr NW
- 4409 Spanish Broom Ct NW
- 4119 Sumac Dr NW
- 4119 Zarzuela Ave NW
- 6301 Coors Blvd NW
- 7708 Ridgeview Dr NW
- 6209 Escoviel St NW
- 7532 Deerfield Rd NW
- 5136 Roanoke Ave NW
- 6409 Coors Blvd NW
- 6104 Santolina Dr NW
- 0 Bosque Plaza Ln NW
- 7739 Ridgeview Dr NW
- 4712 Galleta Rd NW
- 4720 Galleta Rd NW
- 4724 Galleta Rd NW
- 7021 Portulaca Dr NW
- 7105 Portulaca Dr NW
- 7109 Portulaca Dr NW
- 4717 Galleta Rd NW
- 4715 Galleta Rd NW
- 7015 Portulaca Dr NW
- 4721 Galleta Rd NW
- 4728 Galleta Rd NW
- 4725 Galleta Rd NW
- 4709 Galleta Rd NW
- 7009 Portulaca Dr NW
- 4705 Galleta Rd NW
- 4732 Galleta Rd NW
- 4729 Galleta Rd NW
- 4704 Snapdragon Rd NW
- 4708 Snapdragon Rd NW
- 7205 Portulaca Dr NW