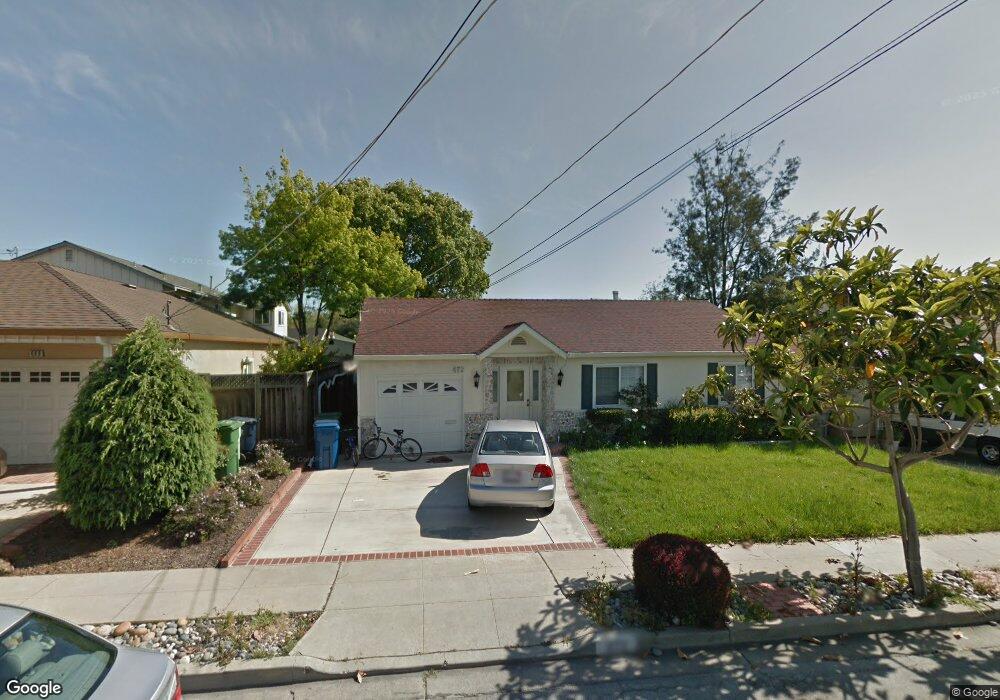
472 Enos St Fremont, CA 94539
Mission San Jose NeighborhoodEstimated Value: $1,713,000 - $2,142,000
4
Beds
2
Baths
1,600
Sq Ft
$1,247/Sq Ft
Est. Value
About This Home
This home is located at 472 Enos St, Fremont, CA 94539 and is currently estimated at $1,994,857, approximately $1,246 per square foot. 472 Enos St is a home located in Alameda County with nearby schools including Joshua Chadbourne Elementary School, William Hopkins Junior High School, and Mission San Jose High School.
Ownership History
Date
Name
Owned For
Owner Type
Purchase Details
Closed on
Jul 1, 2015
Sold by
Nilanjan Sharmaan Anamika and Nilanjan Sarkaran
Bought by
Wei Chongguang and Guo Caihong
Current Estimated Value
Home Financials for this Owner
Home Financials are based on the most recent Mortgage that was taken out on this home.
Original Mortgage
$1,000,000
Outstanding Balance
$778,376
Interest Rate
3.81%
Mortgage Type
New Conventional
Estimated Equity
$1,216,481
Purchase Details
Closed on
Oct 1, 2009
Sold by
Qian Zuwei and Liu Li
Bought by
Sharma Anamika and Sarkar Nilanjan
Home Financials for this Owner
Home Financials are based on the most recent Mortgage that was taken out on this home.
Original Mortgage
$632,000
Interest Rate
5.14%
Mortgage Type
New Conventional
Purchase Details
Closed on
Feb 23, 2001
Sold by
Small Joe C and Small Diane M
Bought by
Qian Zuwei and Liu Li
Home Financials for this Owner
Home Financials are based on the most recent Mortgage that was taken out on this home.
Original Mortgage
$412,000
Interest Rate
7.37%
Create a Home Valuation Report for This Property
The Home Valuation Report is an in-depth analysis detailing your home's value as well as a comparison with similar homes in the area
Home Values in the Area
Average Home Value in this Area
Purchase History
| Date | Buyer | Sale Price | Title Company |
|---|---|---|---|
| Wei Chongguang | $1,286,000 | Fidelity National Title Co | |
| Sharma Anamika | $790,000 | Fidelity National Title Co | |
| Qian Zuwei | $515,000 | Commonwealth Land Title Co |
Source: Public Records
Mortgage History
| Date | Status | Borrower | Loan Amount |
|---|---|---|---|
| Open | Wei Chongguang | $1,000,000 | |
| Previous Owner | Sharma Anamika | $632,000 | |
| Previous Owner | Qian Zuwei | $412,000 |
Source: Public Records
Tax History Compared to Growth
Tax History
| Year | Tax Paid | Tax Assessment Tax Assessment Total Assessment is a certain percentage of the fair market value that is determined by local assessors to be the total taxable value of land and additions on the property. | Land | Improvement |
|---|---|---|---|---|
| 2025 | $17,653 | $1,515,328 | $591,885 | $930,443 |
| 2024 | $17,653 | $1,485,480 | $580,280 | $912,200 |
| 2023 | $17,198 | $1,463,223 | $568,905 | $894,318 |
| 2022 | $17,001 | $1,427,533 | $557,750 | $876,783 |
| 2021 | $16,577 | $1,399,408 | $546,815 | $859,593 |
| 2020 | $16,708 | $1,391,992 | $541,210 | $850,782 |
| 2019 | $16,512 | $1,364,703 | $530,600 | $834,103 |
| 2018 | $16,193 | $1,337,954 | $520,200 | $817,754 |
| 2017 | $15,787 | $1,311,720 | $510,000 | $801,720 |
| 2016 | $15,532 | $1,286,000 | $500,000 | $786,000 |
| 2015 | $10,428 | $848,467 | $515,524 | $332,943 |
| 2014 | $10,251 | $831,853 | $505,430 | $326,423 |
Source: Public Records
Map
Nearby Homes
- 341 Dana St
- 335 Via Rosario
- 43382 Bryant St
- 42955 Corte Verde
- 42965 Corte Verde
- 905 Glenhill Dr
- 138 Telles Ln
- 43547 Ellsworth St
- 124 Linmore Dr
- 483 Becado Place
- 463 Becado Place
- 646 Bella Vista Ct
- 1873 Berry Ct
- 42329 Troyer Ave
- 2164 Ocaso Camino
- 2225 Valorie St
- 42099 Vinha Way
- 1224 Bedford St
- 600 Praderia Cir
- 379 Felipe Common
- 484 Enos St
- 460 Enos St
- 43275 Coit Ave
- 490 Enos St
- 449 Pariso Terrace
- 43291 Coit Ave
- 469 Washington Blvd
- 455 Pariso Terrace
- 502 Enos St
- 465 Enos St
- 467 Pariso Terrace
- 493 Washington Blvd
- 477 Enos St
- 43241 Coit Ave
- 457 Washington Blvd
- 475 Pariso Terrace
- 487 Enos St
- 514 Enos St
- 483 Pariso Terrace
- 43264 Coit Ave