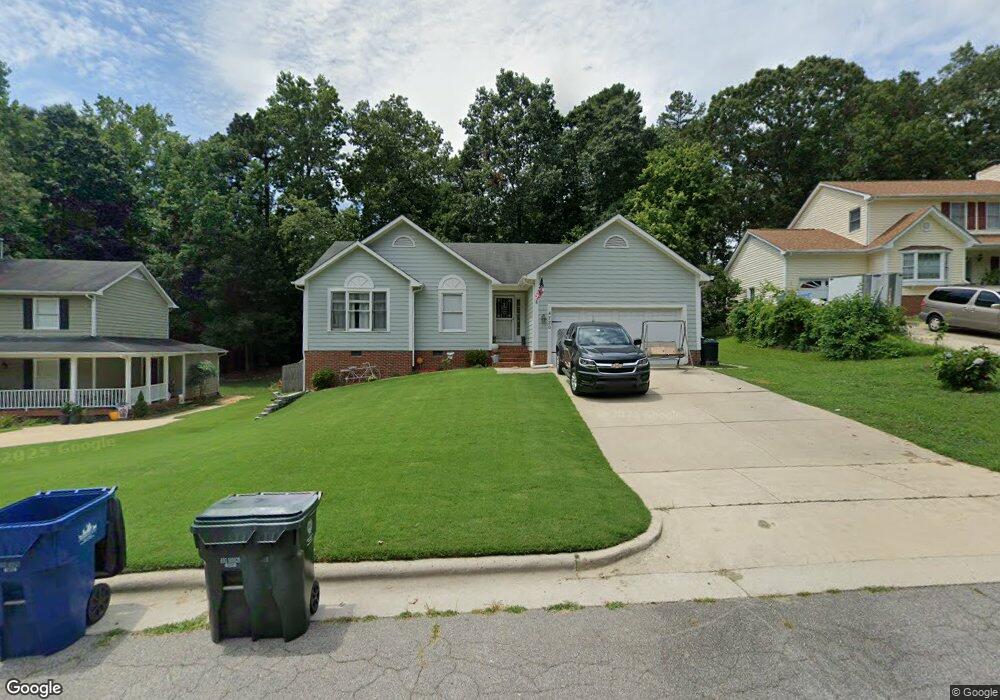
4720 Bivens Dr Raleigh, NC 27616
Northeast Raleigh NeighborhoodEstimated Value: $344,000 - $355,000
3
Beds
2
Baths
1,484
Sq Ft
$236/Sq Ft
Est. Value
About This Home
This home is located at 4720 Bivens Dr, Raleigh, NC 27616 and is currently estimated at $349,514, approximately $235 per square foot. 4720 Bivens Dr is a home located in Wake County with nearby schools including Fox Road Elementary School, Wake Forest-Rolesville Middle School, and Wakefield High School.
Ownership History
Date
Name
Owned For
Owner Type
Purchase Details
Closed on
Jun 21, 2013
Sold by
Duncan Scott D and Duncan Pamela K
Bought by
Miller Timothy A and Miller Amanda
Current Estimated Value
Home Financials for this Owner
Home Financials are based on the most recent Mortgage that was taken out on this home.
Original Mortgage
$123,200
Outstanding Balance
$87,364
Interest Rate
3.42%
Mortgage Type
New Conventional
Estimated Equity
$262,150
Purchase Details
Closed on
Nov 7, 2006
Sold by
Mccray Michael C and Mccray Gena
Bought by
Duncan Scott D and Duncan Pamela K
Home Financials for this Owner
Home Financials are based on the most recent Mortgage that was taken out on this home.
Original Mortgage
$111,900
Interest Rate
6.31%
Mortgage Type
Purchase Money Mortgage
Purchase Details
Closed on
Aug 24, 2001
Sold by
Lambert Archie L and Lambert Dorris J
Bought by
Mccray Michael C
Home Financials for this Owner
Home Financials are based on the most recent Mortgage that was taken out on this home.
Original Mortgage
$122,213
Interest Rate
6.12%
Create a Home Valuation Report for This Property
The Home Valuation Report is an in-depth analysis detailing your home's value as well as a comparison with similar homes in the area
Home Values in the Area
Average Home Value in this Area
Purchase History
| Date | Buyer | Sale Price | Title Company |
|---|---|---|---|
| Miller Timothy A | $308,000 | None Available | |
| Duncan Scott D | $160,000 | None Available | |
| Mccray Michael C | $133,000 | -- |
Source: Public Records
Mortgage History
| Date | Status | Borrower | Loan Amount |
|---|---|---|---|
| Open | Miller Timothy A | $123,200 | |
| Previous Owner | Duncan Scott D | $111,900 | |
| Previous Owner | Mccray Michael C | $122,213 |
Source: Public Records
Tax History Compared to Growth
Tax History
| Year | Tax Paid | Tax Assessment Tax Assessment Total Assessment is a certain percentage of the fair market value that is determined by local assessors to be the total taxable value of land and additions on the property. | Land | Improvement |
|---|---|---|---|---|
| 2025 | $3,261 | $371,574 | $100,000 | $271,574 |
| 2024 | $3,247 | $371,574 | $100,000 | $271,574 |
| 2023 | $2,556 | $232,696 | $56,000 | $176,696 |
| 2022 | $2,376 | $232,696 | $56,000 | $176,696 |
| 2021 | $2,284 | $232,696 | $56,000 | $176,696 |
| 2020 | $2,243 | $232,696 | $56,000 | $176,696 |
| 2019 | $2,132 | $182,248 | $45,000 | $137,248 |
| 2018 | $2,011 | $182,248 | $45,000 | $137,248 |
| 2017 | $1,916 | $178,139 | $45,000 | $133,139 |
| 2016 | $1,835 | $178,139 | $45,000 | $133,139 |
| 2015 | $1,768 | $168,773 | $42,000 | $126,773 |
| 2014 | $1,677 | $168,773 | $42,000 | $126,773 |
Source: Public Records
Map
Nearby Homes
- 6305 Musket Ball Ct
- 4804 Red Coat Ct
- 6016 Four Townes Ln
- 5946 Kohler Ln
- 4905 Will-O-dean Rd
- 4804 Sinclair Dr
- 5708 Sea Fox Ct
- 6205 Remington Lake Dr
- 7026 Jeffreys Creek Ln
- 5208 Botany Bay Dr
- 5223 Botany Bay Dr
- 6923 Fox Haven Place
- 4804 Spring Forest Rd
- 2873 Springtooth Dr
- 7205 Beaverwood Dr
- 7317 Fox Rd
- 4610 Jacqueline Ln
- 4804 Tolley Ct
- 4604 Jacqueline Ln
- 4809 Hallam Way
- 4716 Bivens Dr
- 4724 Bivens Dr
- 4712 Bivens Dr
- 6113 Powder Horn Ct
- 6109 Powder Horn Ct
- 4721 Bivens Dr
- 4717 Bivens Dr
- 6404 Fox Rd
- 4708 Bivens Dr
- 4713 Bivens Dr
- 6408 Fox Rd
- 4725 Bivens Dr
- 6105 Powder Horn Ct
- 4800 Hedgerow Dr
- 4704 Bivens Dr
- 6400 Fox Rd
- 6420 Fox Rd
- 6320 Fox Rd
- 4801 Bivens Dr
- 6112 Powder Horn Ct