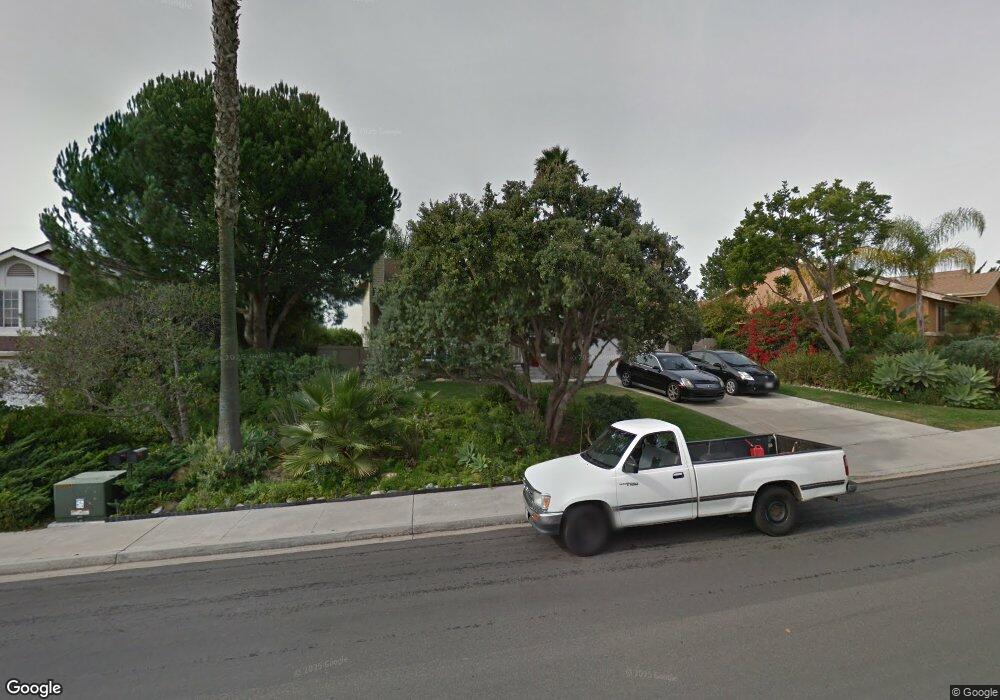
4725 Edinburgh Dr Carlsbad, CA 92010
Calavera Hills NeighborhoodEstimated Value: $1,575,000 - $1,917,000
4
Beds
3
Baths
2,700
Sq Ft
$631/Sq Ft
Est. Value
About This Home
This home is located at 4725 Edinburgh Dr, Carlsbad, CA 92010 and is currently estimated at $1,702,711, approximately $630 per square foot. 4725 Edinburgh Dr is a home located in San Diego County with nearby schools including Hope Elementary School, Calavera Hills Middle, and Sage Creek High.
Ownership History
Date
Name
Owned For
Owner Type
Purchase Details
Closed on
Aug 28, 2012
Sold by
Erisman Brian P and Winitz Maria B
Bought by
Erisman Brian P and Winitz Maria B
Current Estimated Value
Home Financials for this Owner
Home Financials are based on the most recent Mortgage that was taken out on this home.
Original Mortgage
$398,300
Outstanding Balance
$274,304
Interest Rate
3.47%
Mortgage Type
New Conventional
Estimated Equity
$1,428,407
Purchase Details
Closed on
Oct 14, 2011
Sold by
Erisman Brian P and Winitz Marla B
Bought by
Erisman Brian P and Erisman Marla B
Purchase Details
Closed on
Jan 25, 2011
Sold by
Cates Charlie S and Cates Nancy C
Bought by
Erisman Brian P and Winitz Maria B
Home Financials for this Owner
Home Financials are based on the most recent Mortgage that was taken out on this home.
Original Mortgage
$406,500
Interest Rate
4.74%
Mortgage Type
New Conventional
Purchase Details
Closed on
Mar 11, 1987
Bought by
Cates Charlie S Nancy C
Create a Home Valuation Report for This Property
The Home Valuation Report is an in-depth analysis detailing your home's value as well as a comparison with similar homes in the area
Home Values in the Area
Average Home Value in this Area
Purchase History
| Date | Buyer | Sale Price | Title Company |
|---|---|---|---|
| Erisman Brian P | -- | Lawyers Title | |
| Erisman Brian P | -- | Lawyers Title | |
| Erisman Brian P | -- | Accommodation | |
| Erisman Brian P | $677,500 | California Title Co | |
| Cates Charlie S Nancy C | $163,800 | -- |
Source: Public Records
Mortgage History
| Date | Status | Borrower | Loan Amount |
|---|---|---|---|
| Open | Erisman Brian P | $398,300 | |
| Closed | Erisman Brian P | $406,500 |
Source: Public Records
Tax History Compared to Growth
Tax History
| Year | Tax Paid | Tax Assessment Tax Assessment Total Assessment is a certain percentage of the fair market value that is determined by local assessors to be the total taxable value of land and additions on the property. | Land | Improvement |
|---|---|---|---|---|
| 2025 | $9,153 | $879,361 | $318,141 | $561,220 |
| 2024 | $9,153 | $862,119 | $311,903 | $550,216 |
| 2023 | $9,105 | $845,216 | $305,788 | $539,428 |
| 2022 | $8,963 | $828,644 | $299,793 | $528,851 |
| 2021 | $8,895 | $812,397 | $293,915 | $518,482 |
| 2020 | $8,834 | $804,068 | $290,902 | $513,166 |
| 2019 | $8,673 | $788,303 | $285,199 | $503,104 |
| 2018 | $8,305 | $772,847 | $279,607 | $493,240 |
| 2017 | $90 | $747,890 | $274,125 | $473,765 |
| 2016 | $7,735 | $733,226 | $268,750 | $464,476 |
| 2015 | $7,703 | $722,214 | $264,714 | $457,500 |
| 2014 | $7,573 | $708,068 | $259,529 | $448,539 |
Source: Public Records
Map
Nearby Homes
- 4772 Gateshead Rd
- 4537 Hartford Place
- 2992 Lexington Cir
- 2957 Lexington Cir
- 4375 Stanford St
- 2880 Englewood Way
- 4583 Chancery Ct
- 2935 Cliff Cir Unit 33
- 3444 Moon Field Dr
- 3461 Rich Field Dr
- 4350 Point Reyes Ct
- 3461 Alander Ct
- 2543 Glasgow Dr
- 2683 Coventry Rd
- 3619 N Fork Ave
- 3019 Glenbrook St
- 4847 Nelson Ct
- 3626 Harwich Dr
- 2591 Regent Rd Unit 52
- 3737 Bergen Peak Place
- 4729 Edinburgh Dr
- 4721 Edinburgh Dr
- 2777 Glasgow Dr
- 2773 Glasgow Dr
- 4733 Edinburgh Dr
- 4717 Edinburgh Dr
- 4726 Edinburgh Dr
- 2766 Inverness Dr
- 4728 Edinburgh Dr
- 2769 Glasgow Dr
- 4722 Edinburgh Dr
- 4730 Edinburgh Dr
- 4737 Edinburgh Dr
- 4720 Edinburgh Dr
- 4734 Edinburgh Dr
- 2765 Glasgow Dr
- 2762 Inverness Dr
- 2774 Dundee Ct
- 4718 Edinburgh Dr
- 4713 Edinburgh Dr