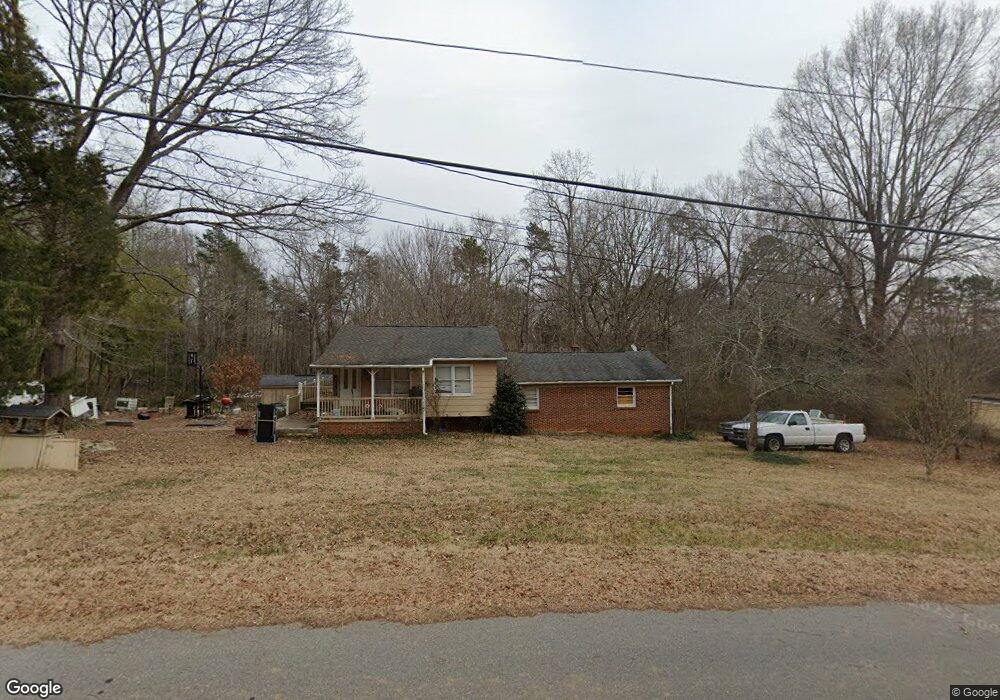
4728 Crowders Crest Dr Gastonia, NC 28052
Estimated Value: $198,000 - $275,000
3
Beds
2
Baths
1,376
Sq Ft
$183/Sq Ft
Est. Value
About This Home
This home is located at 4728 Crowders Crest Dr, Gastonia, NC 28052 and is currently estimated at $252,012, approximately $183 per square foot. 4728 Crowders Crest Dr is a home located in Gaston County with nearby schools including Chapel Grove Elementary School, Southwest Middle School, and Hunter Huss High School.
Ownership History
Date
Name
Owned For
Owner Type
Purchase Details
Closed on
May 11, 2017
Sold by
Pepper Stacy
Bought by
Hensley Kamie
Current Estimated Value
Home Financials for this Owner
Home Financials are based on the most recent Mortgage that was taken out on this home.
Original Mortgage
$110,364
Outstanding Balance
$92,770
Interest Rate
4.5%
Mortgage Type
FHA
Estimated Equity
$159,242
Purchase Details
Closed on
Jul 7, 2014
Sold by
Dye Shelby Jean
Bought by
Pepper Stacy
Purchase Details
Closed on
Nov 12, 2013
Sold by
Brezeale Chad Ervin and Brezeale Christy Lee
Bought by
Payne Evonne and Payne Billy
Purchase Details
Closed on
Mar 28, 2008
Sold by
Brezeale Ervin Mcgill and Brezeale Beverly
Bought by
Brezeale Chad Ervin and Brezeale Christy Lee
Create a Home Valuation Report for This Property
The Home Valuation Report is an in-depth analysis detailing your home's value as well as a comparison with similar homes in the area
Home Values in the Area
Average Home Value in this Area
Purchase History
| Date | Buyer | Sale Price | Title Company |
|---|---|---|---|
| Hensley Kamie | $112,500 | None Available | |
| Pepper Stacy | $50,000 | None Available | |
| Payne Evonne | $85,000 | None Available | |
| Brezeale Chad Ervin | -- | Chicago Title Insurance Co |
Source: Public Records
Mortgage History
| Date | Status | Borrower | Loan Amount |
|---|---|---|---|
| Open | Hensley Kamie | $110,364 | |
| Closed | Hensley Kamie | $110,364 |
Source: Public Records
Tax History Compared to Growth
Tax History
| Year | Tax Paid | Tax Assessment Tax Assessment Total Assessment is a certain percentage of the fair market value that is determined by local assessors to be the total taxable value of land and additions on the property. | Land | Improvement |
|---|---|---|---|---|
| 2025 | $1,435 | $201,030 | $36,860 | $164,170 |
| 2024 | $1,435 | $201,030 | $36,860 | $164,170 |
| 2023 | $1,397 | $201,030 | $36,860 | $164,170 |
| 2022 | $915 | $99,460 | $26,340 | $73,120 |
| 2021 | $918 | $99,460 | $26,340 | $73,120 |
| 2019 | $928 | $99,460 | $26,340 | $73,120 |
| 2018 | $889 | $91,184 | $27,896 | $63,288 |
| 2017 | $880 | $91,184 | $27,896 | $63,288 |
| 2016 | $880 | $90,253 | $0 | $0 |
| 2014 | $867 | $89,880 | $36,170 | $53,710 |
Source: Public Records
Map
Nearby Homes
- 608 Crowders Creek Rd
- 113 Lou Dr
- 416 Donna Ave
- 4636 Merrywood Ln
- 4606 Cloverwood Ln
- 2300 Oakstone Cir
- 4841 Greenwood Dr
- 1041 Crowders Creek Rd
- 0000 Woodcrest Dr
- 107 Pecan Grove Cir Unit 11
- 727 Cove Rd
- 226 Lingerfelt Dr
- 220 Lingerfelt Dr
- 110 Jeran Ln
- 1114 Courtney Cove Ct
- 1014 Spring Dr
- 129 Hannaford Place
- 0 York Hwy
- TBD York Hwy
- 4417 Grier St
- 4736 Crowders Crest Dr
- 4727 Crowders Crest Dr
- 4640 Crowders Crest Dr
- 4746 Crowders Crest Dr
- 4750 Crowders Crest Dr
- 4611 Crowders Crest Dr
- 518 Crowders Creek Rd
- 4749 Crowders Crest Dr
- 123 Fraggle Rock Trail
- 119 Fraggle Rock Trail
- 614 Crowders Creek Rd
- 4545 Crowders Crest Dr Unit .69
- 620 Crowders Creek Rd
- 508 Crowders Creek Rd
- 504 Crowders Creek Rd
- 4535 Crowders Crest Dr
- 112 Fraggle Rock Trail
- 100 Donna Ave
- 104 Donna Ave
- 4436 Crowders Crest Dr