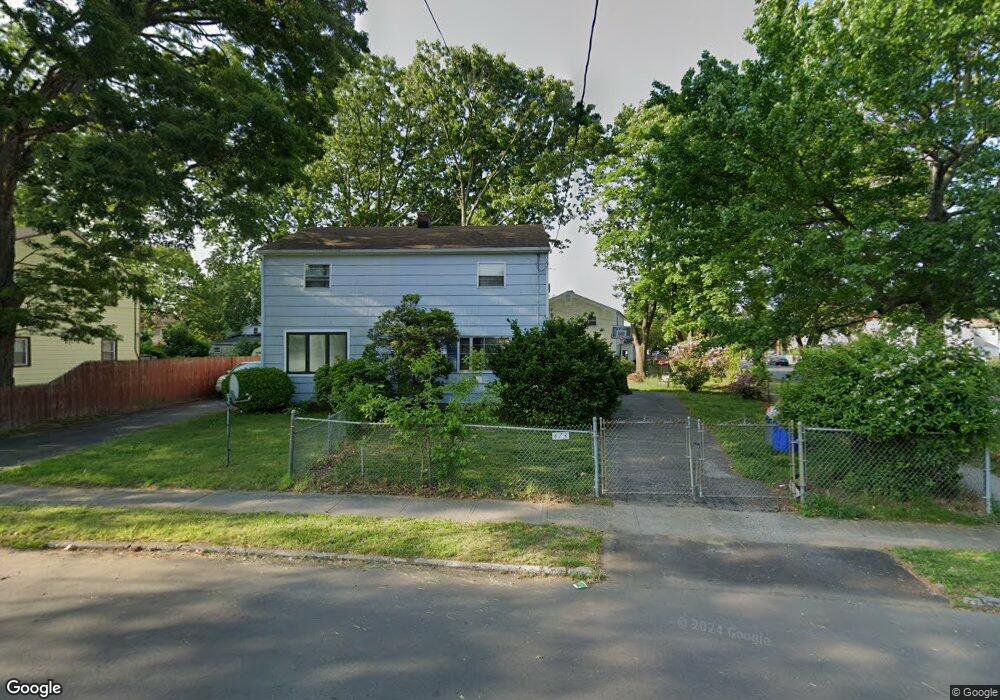
473 Columbus Ave Stratford, CT 06615
Stratford Center Historic District NeighborhoodEstimated Value: $239,883 - $275,000
2
Beds
1
Bath
952
Sq Ft
$266/Sq Ft
Est. Value
About This Home
This home is located at 473 Columbus Ave, Stratford, CT 06615 and is currently estimated at $253,221, approximately $265 per square foot. 473 Columbus Ave is a home located in Fairfield County with nearby schools including Stratford Academy - Johnson House, David Wooster Middle School, and Stratford High School.
Ownership History
Date
Name
Owned For
Owner Type
Purchase Details
Closed on
Mar 25, 2022
Sold by
Rollo Danette L and Rollo Kenneth M
Bought by
Mccallister Willie
Current Estimated Value
Purchase Details
Closed on
Sep 10, 2015
Sold by
Rollo Danette L
Bought by
Rollo Danette L and Rollo Kenneth M
Home Financials for this Owner
Home Financials are based on the most recent Mortgage that was taken out on this home.
Original Mortgage
$119,100
Interest Rate
4.01%
Purchase Details
Closed on
Dec 21, 2007
Sold by
Tang Jeffrey
Bought by
Rollo Danette
Home Financials for this Owner
Home Financials are based on the most recent Mortgage that was taken out on this home.
Original Mortgage
$127,000
Interest Rate
6.3%
Purchase Details
Closed on
May 6, 2005
Sold by
Rabideau Nelson
Bought by
Tang Jeffrey
Home Financials for this Owner
Home Financials are based on the most recent Mortgage that was taken out on this home.
Original Mortgage
$99,200
Interest Rate
6.01%
Create a Home Valuation Report for This Property
The Home Valuation Report is an in-depth analysis detailing your home's value as well as a comparison with similar homes in the area
Home Values in the Area
Average Home Value in this Area
Purchase History
| Date | Buyer | Sale Price | Title Company |
|---|---|---|---|
| Mccallister Willie | $115,000 | None Available | |
| Rollo Danette L | -- | -- | |
| Rollo Danette | $127,000 | -- | |
| Tang Jeffrey | $124,000 | -- |
Source: Public Records
Mortgage History
| Date | Status | Borrower | Loan Amount |
|---|---|---|---|
| Previous Owner | Rollo Danette L | $119,100 | |
| Previous Owner | Tang Jeffrey | $167,373 | |
| Previous Owner | Tang Jeffrey | $127,000 | |
| Previous Owner | Tang Jeffrey | $99,200 |
Source: Public Records
Tax History Compared to Growth
Tax History
| Year | Tax Paid | Tax Assessment Tax Assessment Total Assessment is a certain percentage of the fair market value that is determined by local assessors to be the total taxable value of land and additions on the property. | Land | Improvement |
|---|---|---|---|---|
| 2025 | $3,492 | $86,860 | $35,340 | $51,520 |
| 2024 | $3,492 | $86,860 | $35,340 | $51,520 |
| 2023 | $3,492 | $86,860 | $35,340 | $51,520 |
| 2022 | $3,427 | $86,860 | $35,340 | $51,520 |
| 2021 | $3,428 | $86,860 | $35,340 | $51,520 |
| 2020 | $3,443 | $86,860 | $35,340 | $51,520 |
| 2019 | $2,436 | $61,100 | $22,250 | $38,850 |
| 2018 | $2,438 | $61,100 | $22,250 | $38,850 |
| 2017 | $2,442 | $61,100 | $22,250 | $38,850 |
| 2016 | $2,382 | $61,100 | $22,250 | $38,850 |
| 2015 | $2,259 | $61,100 | $22,250 | $38,850 |
| 2014 | $2,257 | $63,340 | $22,950 | $40,390 |
Source: Public Records
Map
Nearby Homes
- 394 Harding Ave
- 366 Columbus Ave
- 238 Larkin Ct
- 325 Mckinley Ave
- 79 Wooster Ave
- 270 Roosevelt Ave
- 216 Mckinley Ave
- 208 Harding Ave
- 107 Dewey St
- 209 Mcgrath Ct
- 148 Columbus Ave
- 126 Garibaldi Ave
- 125 Garibaldi Ave
- 28 Frash St
- 65 Masarik Ave
- 66 Roosevelt Ave
- 15 Harding Ave
- 291 Birdseye St
- 909 Main St
- 88 Boswell St
- 245 Larkin Ct
- 476 Columbus Ave
- 475 Columbus Ave
- 466 Columbus Ave
- 474 Columbus Ave
- 464 Columbus Ave
- 465 Columbus Ave
- 483 Columbus Ave
- 493 Columbus Ave
- 243 Larkin Ct
- 463 Columbus Ave
- 456 Columbus Ave
- 486 Columbus Ave
- 436 Garibaldi Ave
- 455 Columbus Ave
- 467 Mckinley Ave
- 495 Columbus Ave
- 434 Garibaldi Ave
- 484 Columbus Ave
- 484 Columbus Ave Unit 1