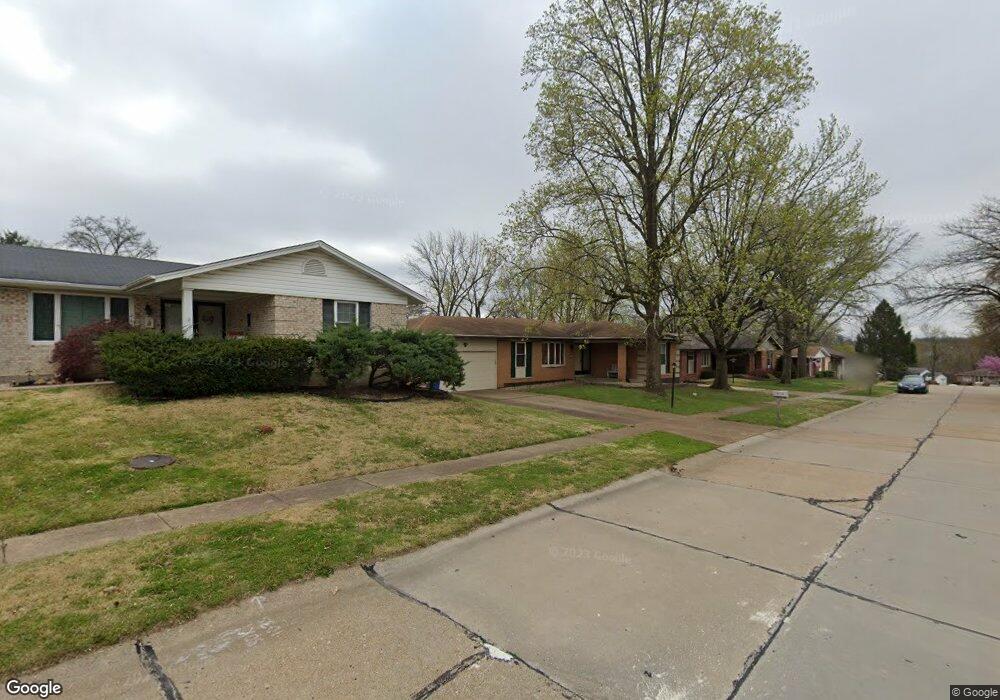
4736 Tonga Dr Saint Louis, MO 63128
Estimated Value: $266,945 - $301,000
3
Beds
2
Baths
1,396
Sq Ft
$204/Sq Ft
Est. Value
About This Home
This home is located at 4736 Tonga Dr, Saint Louis, MO 63128 and is currently estimated at $285,236, approximately $204 per square foot. 4736 Tonga Dr is a home located in St. Louis County with nearby schools including Trautwein Elementary School, Washington Middle School, and Mehlville High School.
Ownership History
Date
Name
Owned For
Owner Type
Purchase Details
Closed on
Aug 18, 2025
Sold by
Zaruba Robert J
Bought by
Robert J Zaruba Revocable Living Trust
Current Estimated Value
Purchase Details
Closed on
Sep 10, 2010
Sold by
Keplinger John S
Bought by
Zaruba Robert J
Home Financials for this Owner
Home Financials are based on the most recent Mortgage that was taken out on this home.
Original Mortgage
$109,800
Interest Rate
4.24%
Mortgage Type
New Conventional
Purchase Details
Closed on
Aug 30, 2005
Sold by
Mowery Deborah Ann
Bought by
Keplinger John S
Home Financials for this Owner
Home Financials are based on the most recent Mortgage that was taken out on this home.
Original Mortgage
$140,300
Interest Rate
5.81%
Mortgage Type
Fannie Mae Freddie Mac
Purchase Details
Closed on
May 31, 2002
Sold by
Seeker Nancy E
Bought by
Mowery Deborah Ann
Home Financials for this Owner
Home Financials are based on the most recent Mortgage that was taken out on this home.
Original Mortgage
$75,000
Interest Rate
6.92%
Create a Home Valuation Report for This Property
The Home Valuation Report is an in-depth analysis detailing your home's value as well as a comparison with similar homes in the area
Home Values in the Area
Average Home Value in this Area
Purchase History
| Date | Buyer | Sale Price | Title Company |
|---|---|---|---|
| Robert J Zaruba Revocable Living Trust | -- | None Listed On Document | |
| Zaruba Robert J | $146,400 | None Available | |
| Keplinger John S | $175,400 | -- | |
| Mowery Deborah Ann | $147,000 | -- |
Source: Public Records
Mortgage History
| Date | Status | Borrower | Loan Amount |
|---|---|---|---|
| Previous Owner | Zaruba Robert J | $109,800 | |
| Previous Owner | Keplinger John S | $140,300 | |
| Previous Owner | Mowery Deborah Ann | $75,000 |
Source: Public Records
Tax History Compared to Growth
Tax History
| Year | Tax Paid | Tax Assessment Tax Assessment Total Assessment is a certain percentage of the fair market value that is determined by local assessors to be the total taxable value of land and additions on the property. | Land | Improvement |
|---|---|---|---|---|
| 2025 | $2,720 | $47,080 | $13,890 | $33,190 |
| 2024 | $2,720 | $40,370 | $10,790 | $29,580 |
| 2023 | $2,685 | $40,370 | $10,790 | $29,580 |
| 2022 | $2,423 | $36,590 | $10,790 | $25,800 |
| 2021 | $2,345 | $36,590 | $10,790 | $25,800 |
| 2020 | $2,277 | $33,780 | $9,270 | $24,510 |
| 2019 | $2,271 | $33,780 | $9,270 | $24,510 |
| 2018 | $1,957 | $26,240 | $7,730 | $18,510 |
| 2017 | $1,954 | $26,240 | $7,730 | $18,510 |
| 2016 | $2,000 | $25,780 | $7,730 | $18,050 |
| 2015 | $1,837 | $25,780 | $7,730 | $18,050 |
| 2014 | -- | $30,820 | $4,660 | $26,160 |
Source: Public Records
Map
Nearby Homes
- 4724 Tarlton Dr
- 4921 Kerth Rd
- 4525 Eli Dr Unit D
- 4501 Eli Dr Unit I
- 4642 Theiss Rd
- 37 Kassebaum Ln Unit 207
- 4700 Theiss Rd
- 33 Kassebaum Ln Unit 305
- 4508 Frederickton Ct
- 27 Kassebaum Ln Unit 202
- 27 Kassebaum Ln Unit 101
- 4818 Chapel Hill Dr
- 4643 Littlebury Dr
- 4829 Vermilion Dr
- 4334 Arrow Tree Dr Unit L
- 4334 Arrow Tree Dr Unit J
- 5134 Butler Hill Ct
- 5251 Tuscan Chase Ct
- 4449 Pinyon Jay Ct
- 4833 Hursley Dr
- 4744 Tonga Dr
- 4728 Tonga Dr
- 4725 Villa Knoll Dr
- 4733 Villa Knoll Dr
- 4752 Tonga Dr
- 4731 Tonga Dr
- 4720 Tonga Dr
- 4717 Villa Knoll Dr
- 4737 Tonga Dr
- 4741 Villa Knoll Dr
- 4723 Tonga Dr
- 4745 Tonga Dr
- 4709 Villa Knoll Dr
- 4760 Tonga Dr
- 4712 Tonga Dr
- 4747 Villa Knoll Dr
- 4758 Fiji Dr
- 4764 Fiji Dr
- 4757 Tonga Dr
- 4734 Fiji Dr