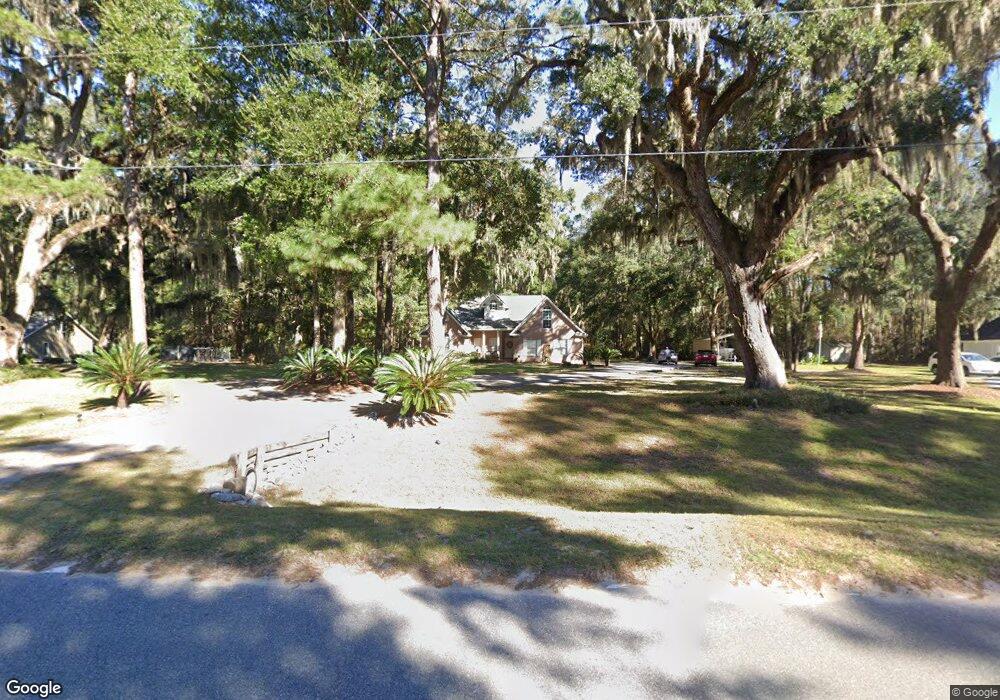
4751 Belfast River Rd Richmond Hill, GA 31324
Estimated Value: $512,000 - $542,000
3
Beds
2
Baths
2,225
Sq Ft
$236/Sq Ft
Est. Value
About This Home
This home is located at 4751 Belfast River Rd, Richmond Hill, GA 31324 and is currently estimated at $525,408, approximately $236 per square foot. 4751 Belfast River Rd is a home located in Bryan County with nearby schools including Frances Meeks Elementary School, Dr. George Washington Carver Elementary School, and Richmond Hill Elementary School.
Ownership History
Date
Name
Owned For
Owner Type
Purchase Details
Closed on
Mar 17, 2021
Sold by
Durfee Cynthia E
Bought by
Landing Chad M and Landing Stephanie R
Current Estimated Value
Home Financials for this Owner
Home Financials are based on the most recent Mortgage that was taken out on this home.
Original Mortgage
$250,000
Outstanding Balance
$224,485
Interest Rate
2.8%
Mortgage Type
New Conventional
Estimated Equity
$300,923
Purchase Details
Closed on
Mar 4, 2015
Sold by
Owens Melissa A
Bought by
Durfee Cynthia E
Purchase Details
Closed on
Jul 31, 2001
Sold by
Tidal Construction I
Bought by
Owens Melissa A and Owens Ro
Purchase Details
Closed on
Feb 8, 2001
Sold by
Bragg David and Bragg Charlo
Bought by
Tidal Construction I
Purchase Details
Closed on
Feb 1, 1986
Bought by
Bragg David and Bragg Charlo
Purchase Details
Closed on
Apr 1, 1984
Create a Home Valuation Report for This Property
The Home Valuation Report is an in-depth analysis detailing your home's value as well as a comparison with similar homes in the area
Home Values in the Area
Average Home Value in this Area
Purchase History
| Date | Buyer | Sale Price | Title Company |
|---|---|---|---|
| Landing Chad M | $400,000 | -- | |
| Durfee Cynthia E | $250,000 | -- | |
| Owens Melissa A | -- | -- | |
| Tidal Construction I | $27,500 | -- | |
| Bragg David | $10,000 | -- | |
| -- | -- | -- |
Source: Public Records
Mortgage History
| Date | Status | Borrower | Loan Amount |
|---|---|---|---|
| Open | Landing Chad M | $250,000 |
Source: Public Records
Tax History Compared to Growth
Tax History
| Year | Tax Paid | Tax Assessment Tax Assessment Total Assessment is a certain percentage of the fair market value that is determined by local assessors to be the total taxable value of land and additions on the property. | Land | Improvement |
|---|---|---|---|---|
| 2024 | $4,199 | $175,080 | $32,480 | $142,600 |
| 2023 | $4,173 | $149,000 | $35,720 | $113,280 |
| 2022 | $3,666 | $146,840 | $35,720 | $111,120 |
| 2021 | $2,014 | $115,680 | $35,720 | $79,960 |
| 2020 | $2,344 | $94,160 | $32,480 | $61,680 |
| 2019 | $1,514 | $94,320 | $32,480 | $61,840 |
| 2018 | $2,611 | $89,800 | $27,480 | $62,320 |
| 2017 | $2,510 | $90,720 | $27,480 | $63,240 |
| 2016 | $2,262 | $79,640 | $17,480 | $62,160 |
| 2015 | $2,257 | $79,120 | $17,480 | $61,640 |
| 2014 | $1,991 | $80,560 | $17,480 | $63,080 |
Source: Public Records
Map
Nearby Homes
- 37 Watergrass Way
- 92 Old Mill Rd E
- 200 Old Mill Rd W
- 4820 Belfast Keller Rd
- 67 Oak Side Ct
- 335 Buckland Hall Rd
- 385 Marshview Dr
- 301 Marshview Dr
- 220 Marshview Dr
- 614 Savannah Rd
- 1108 Saint Catherine Cir
- 1913 Saint Catherine Cir
- 382 Savannah Rd
- 78 Heron View Ct
- 43 Heron View Ct
- 98 Peregrine Cir
- 268 Catherine View
- 352 Harbour Ln
- 41 Peregrine Cir
- 187 Harbour Ln
- 4751 Belfast River Rd
- 4777 Belfast River Rd
- 4613 Belfast River Rd
- 134 Belfast Pines Dr
- 157 Maddy Way
- 156 Palmer Place
- 136 Palmer Place
- 117 Palmer Place
- 129 Maddy Way
- 25 Whistler Way
- 95 Maddy Way
- 101 Palmer Place
- 30 Whistler Way
- 181 Maddy Way
- 4744 Belfast River Rd
- 4796 Belfast River Rd
- 4567 Belfast River Rd
- 15 Old Mill Rd E
- 89 Old Mill Rd E