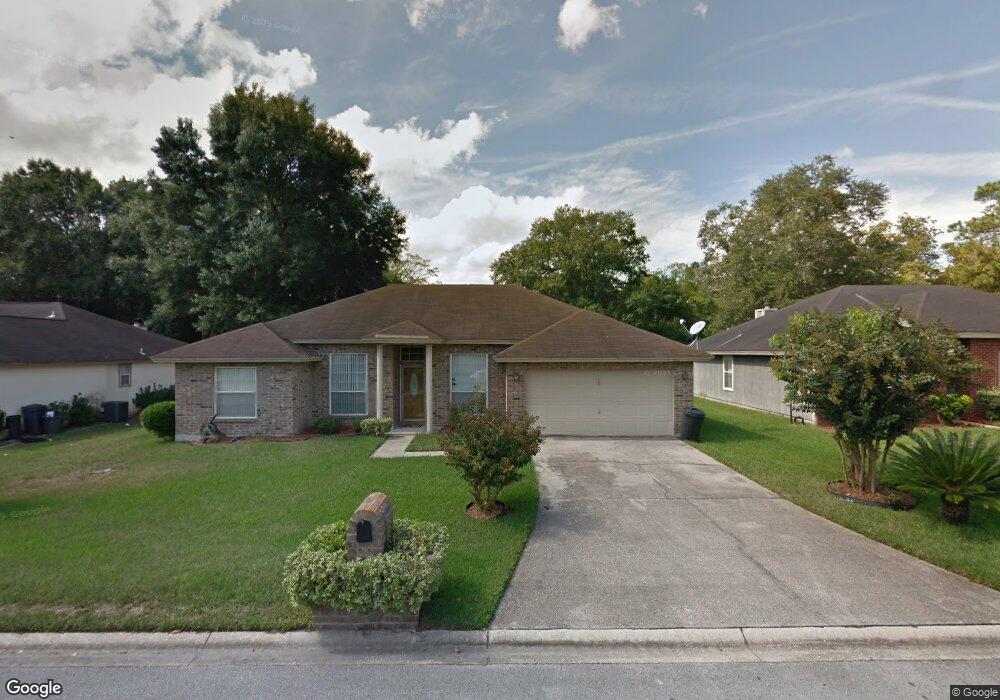
4752 Fireside Dr W Jacksonville, FL 32210
Cedar Hills NeighborhoodEstimated Value: $244,462 - $274,000
3
Beds
2
Baths
1,770
Sq Ft
$147/Sq Ft
Est. Value
About This Home
This home is located at 4752 Fireside Dr W, Jacksonville, FL 32210 and is currently estimated at $260,616, approximately $147 per square foot. 4752 Fireside Dr W is a home located in Duval County with nearby schools including Jacksonville Heights Elementary School, Westside High School, and Builders of the Faith Christian Academy.
Ownership History
Date
Name
Owned For
Owner Type
Purchase Details
Closed on
Mar 9, 2006
Sold by
Walls Fannie C and Dennard Fannie C
Bought by
Dennard Larry D and Dennard Fannie C
Current Estimated Value
Purchase Details
Closed on
Dec 15, 2005
Sold by
Williams Anthony J and Williams Karen V
Bought by
Walls Fannie C
Home Financials for this Owner
Home Financials are based on the most recent Mortgage that was taken out on this home.
Original Mortgage
$148,500
Outstanding Balance
$82,592
Interest Rate
6.19%
Mortgage Type
Fannie Mae Freddie Mac
Estimated Equity
$178,024
Purchase Details
Closed on
Feb 28, 1997
Sold by
Al Jordan Enterprises Inc
Bought by
Williams Anthony J and Williams Karen
Home Financials for this Owner
Home Financials are based on the most recent Mortgage that was taken out on this home.
Original Mortgage
$101,892
Interest Rate
7.9%
Mortgage Type
FHA
Purchase Details
Closed on
Oct 23, 1996
Sold by
M E Kenyon Company
Bought by
Al Jordan Enterprises Inc
Create a Home Valuation Report for This Property
The Home Valuation Report is an in-depth analysis detailing your home's value as well as a comparison with similar homes in the area
Home Values in the Area
Average Home Value in this Area
Purchase History
| Date | Buyer | Sale Price | Title Company |
|---|---|---|---|
| Dennard Larry D | $72,500 | None Available | |
| Walls Fannie C | $165,000 | Elite Title Escrow Svcs | |
| Williams Anthony J | $105,300 | -- | |
| Al Jordan Enterprises Inc | $18,000 | -- |
Source: Public Records
Mortgage History
| Date | Status | Borrower | Loan Amount |
|---|---|---|---|
| Open | Walls Fannie C | $148,500 | |
| Previous Owner | Williams Anthony J | $101,892 |
Source: Public Records
Tax History Compared to Growth
Tax History
| Year | Tax Paid | Tax Assessment Tax Assessment Total Assessment is a certain percentage of the fair market value that is determined by local assessors to be the total taxable value of land and additions on the property. | Land | Improvement |
|---|---|---|---|---|
| 2025 | $1,816 | $134,737 | -- | -- |
| 2024 | $1,757 | $130,940 | -- | -- |
| 2023 | $1,757 | $127,127 | $0 | $0 |
| 2022 | $1,599 | $123,425 | $0 | $0 |
| 2021 | $1,579 | $119,831 | $0 | $0 |
| 2020 | $1,560 | $118,177 | $0 | $0 |
| 2019 | $1,536 | $115,521 | $0 | $0 |
| 2018 | $1,511 | $113,368 | $0 | $0 |
| 2017 | $1,487 | $111,037 | $0 | $0 |
| 2016 | $1,473 | $108,754 | $0 | $0 |
| 2015 | $1,637 | $116,006 | $0 | $0 |
| 2014 | $1,627 | $114,526 | $0 | $0 |
Source: Public Records
Map
Nearby Homes
- 4722 Fireside Dr W
- 4718 Redstone Dr
- 4803 Redstone Dr
- 7326 Melvin Rd
- 7335 Proxima Rd
- 7259 Sabal Terrace
- 7251 Sabal Terrace
- 7257 Sabal Terrace
- 7253 Sabal Terrace
- 7243 Sabal Terrace
- 7239 Sabal Terrace
- 7241 Sabal Terrace
- 7235 Sabal Terrace
- 7237 Sabal Terrace
- 7231 Sabal Terrace
- 7233 Sabal Terrace
- 7219 Sabal Terrace
- 7221 Sabal Terrace
- 7217 Sabal Terrace
- 7211 Sabal Terrace
- 4746 Fireside Dr W
- 4747 Fireside Dr W
- 4759 Fireside Dr W
- 4735 Redstone Dr
- 4725 Redstone Dr
- 4743 Redstone Dr Unit 9
- 4715 Redstone Dr
- 4741 Fireside Dr W
- 4770 Fireside Dr W
- 7231 Fireside Dr
- 4728 Fireside Dr W
- 4813 Redstone Dr
- 4776 Fireside Dr W
- 4645 Redstone Dr
- 4729 Fireside Dr W
- 7221 Fireside Dr
- 4782 Fireside Dr W
- 4728 Redstone Dr
- 4740 Redstone Dr
- 4744 Fireside Ct