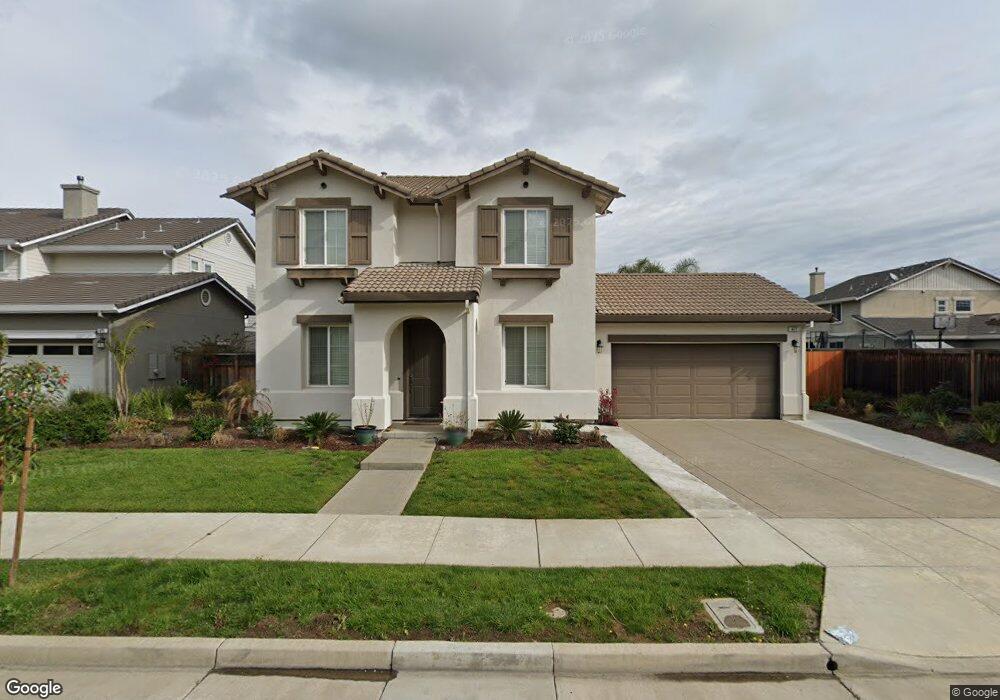
477 Richdale Ct Brentwood, CA 94513
Brentwood Center NeighborhoodEstimated Value: $793,000 - $887,000
5
Beds
3
Baths
2,462
Sq Ft
$343/Sq Ft
Est. Value
About This Home
This home is located at 477 Richdale Ct, Brentwood, CA 94513 and is currently estimated at $844,877, approximately $343 per square foot. 477 Richdale Ct is a home located in Contra Costa County with nearby schools including Mary Casey Black Elementary School, Edna Hill Middle School, and Liberty High School.
Ownership History
Date
Name
Owned For
Owner Type
Purchase Details
Closed on
Jul 2, 2013
Sold by
Signature At Cedarwood Llc
Bought by
Chayra Harpinder and Chayra Prinka K
Current Estimated Value
Home Financials for this Owner
Home Financials are based on the most recent Mortgage that was taken out on this home.
Original Mortgage
$398,351
Outstanding Balance
$288,061
Interest Rate
3.79%
Mortgage Type
FHA
Estimated Equity
$556,816
Create a Home Valuation Report for This Property
The Home Valuation Report is an in-depth analysis detailing your home's value as well as a comparison with similar homes in the area
Home Values in the Area
Average Home Value in this Area
Purchase History
| Date | Buyer | Sale Price | Title Company |
|---|---|---|---|
| Chayra Harpinder | $435,000 | Old Republic Title Company |
Source: Public Records
Mortgage History
| Date | Status | Borrower | Loan Amount |
|---|---|---|---|
| Open | Chayra Harpinder | $398,351 |
Source: Public Records
Tax History Compared to Growth
Tax History
| Year | Tax Paid | Tax Assessment Tax Assessment Total Assessment is a certain percentage of the fair market value that is determined by local assessors to be the total taxable value of land and additions on the property. | Land | Improvement |
|---|---|---|---|---|
| 2025 | $9,113 | $533,241 | $110,323 | $422,918 |
| 2024 | $9,113 | $522,786 | $108,160 | $414,626 |
| 2023 | $8,870 | $512,537 | $106,040 | $406,497 |
| 2022 | $8,632 | $502,488 | $103,961 | $398,527 |
| 2021 | $8,440 | $492,636 | $101,923 | $390,713 |
| 2019 | $8,417 | $478,025 | $98,900 | $379,125 |
| 2018 | $8,276 | $468,653 | $96,961 | $371,692 |
| 2017 | $8,183 | $459,464 | $95,060 | $364,404 |
| 2016 | $7,808 | $450,456 | $93,197 | $357,259 |
| 2015 | $7,815 | $443,691 | $91,798 | $351,893 |
| 2014 | $7,674 | $435,000 | $90,000 | $345,000 |
Source: Public Records
Map
Nearby Homes
- 475 Richdale Ct
- 487 Richdale Ct
- 489 Richdale Ct
- 526 Vivian St
- 524 Vivian St
- 473 Richdale Ct
- 491 Richdale Ct
- 476 Richdale Ct
- 522 Vivian St
- 478 Richdale Ct
- 474 Richdale Ct
- 480 Richdale Ct
- 472 Richdale Ct
- 488 Richdale Ct
- 534 Vivian St
- 486 Richdale Ct
- 527 Vivian St
- 482 Richdale Ct
- 525 Vivian St
- 529 Vivian St