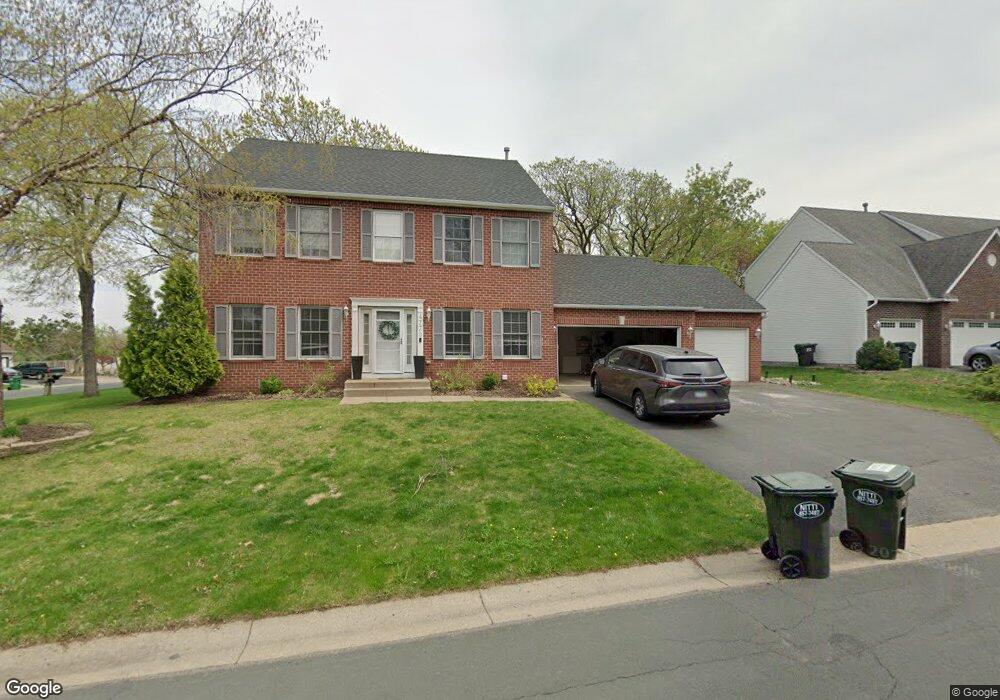
4770 Highcroft Ct Saint Paul, MN 55122
Estimated Value: $544,846 - $592,000
5
Beds
4
Baths
2,144
Sq Ft
$266/Sq Ft
Est. Value
About This Home
This home is located at 4770 Highcroft Ct, Saint Paul, MN 55122 and is currently estimated at $571,212, approximately $266 per square foot. 4770 Highcroft Ct is a home located in Dakota County with nearby schools including Oak Ridge Elementary School, Black Hawk Middle School, and Eastview Senior High School.
Ownership History
Date
Name
Owned For
Owner Type
Purchase Details
Closed on
Jun 23, 2017
Sold by
Tenlev John and Tenlev Kristen
Bought by
Moore Christopher J and Moore Jessica M
Current Estimated Value
Home Financials for this Owner
Home Financials are based on the most recent Mortgage that was taken out on this home.
Original Mortgage
$311,920
Outstanding Balance
$258,882
Interest Rate
3.94%
Mortgage Type
New Conventional
Estimated Equity
$312,330
Purchase Details
Closed on
Mar 22, 2011
Sold by
Garrett Charles Gustav and Garrett Jennifer Lynn
Bought by
Tenley John and Tenley Kristen
Purchase Details
Closed on
May 19, 1998
Sold by
Meisenholder Todd and Meisenholder Patricia
Bought by
Garrett Charles G
Purchase Details
Closed on
Jun 21, 1996
Sold by
-Inc D R Horton
Bought by
Meisenholder Todd A and Meisenholder Patricia N
Create a Home Valuation Report for This Property
The Home Valuation Report is an in-depth analysis detailing your home's value as well as a comparison with similar homes in the area
Home Values in the Area
Average Home Value in this Area
Purchase History
| Date | Buyer | Sale Price | Title Company |
|---|---|---|---|
| Moore Christopher J | $389,900 | Burnet Title | |
| Tenley John | $309,000 | First American Title | |
| Garrett Charles G | $230,000 | -- | |
| Meisenholder Todd A | $213,912 | -- |
Source: Public Records
Mortgage History
| Date | Status | Borrower | Loan Amount |
|---|---|---|---|
| Open | Moore Christopher J | $311,920 |
Source: Public Records
Tax History Compared to Growth
Tax History
| Year | Tax Paid | Tax Assessment Tax Assessment Total Assessment is a certain percentage of the fair market value that is determined by local assessors to be the total taxable value of land and additions on the property. | Land | Improvement |
|---|---|---|---|---|
| 2024 | $5,308 | $483,900 | $126,700 | $357,200 |
| 2023 | $5,308 | $488,700 | $127,000 | $361,700 |
| 2022 | $4,576 | $464,100 | $126,700 | $337,400 |
| 2021 | $4,400 | $407,400 | $110,200 | $297,200 |
| 2020 | $4,434 | $383,700 | $104,900 | $278,800 |
| 2019 | $3,895 | $376,800 | $99,900 | $276,900 |
| 2018 | $3,911 | $350,700 | $95,200 | $255,500 |
| 2017 | $3,988 | $341,300 | $90,700 | $250,600 |
| 2016 | $3,959 | $332,400 | $86,300 | $246,100 |
| 2015 | $3,932 | $319,844 | $84,257 | $235,587 |
| 2014 | -- | $323,223 | $82,101 | $241,122 |
| 2013 | -- | $295,210 | $73,754 | $221,456 |
Source: Public Records
Map
Nearby Homes
- 4774 Slater Rd
- 4632 Westwood Ln
- 2100 Viburnum Trail
- 2107 Kings Rd
- 2065 Kings Rd
- 247 River Woods Ln
- 3309 Red Oak Cir N
- 319 River Woods Ln
- 221 River Woods Ln
- 188 River Woods Ln
- 146 River Woods Ln
- 145 River Woods Ln
- 11902 River Hills Cir
- 2123 Cliffhill Ln
- 4463 Cinnamon Ridge Cir
- 55 River Woods Ln
- 72 River Woods Ln
- 12068 Gantry Ln
- 11921 Baypoint Dr
- 12640 Tiffany Ct
- 4774 Highcroft Ct
- 2144 Warrick Ct
- 2151 Warrick Ct
- 4778 Highcroft Ct
- 4771 Highcroft Ct
- 2141 Warrick Ct
- 2140 Warrick Ct
- 4775 Highcroft Ct
- 2147 Warrick Ct
- 4782 Highcroft Ct
- 2155 Warrick Ct
- 2136 Warrick Ct
- 4779 Highcroft Ct
- 2159 Warrick Ct
- 4770 Slater Rd
- 4783 Highcroft Ct
- 2163 Warrick Ct
- 4778 Slater Rd
- 4680 Slater Rd
- 4686 Slater Rd