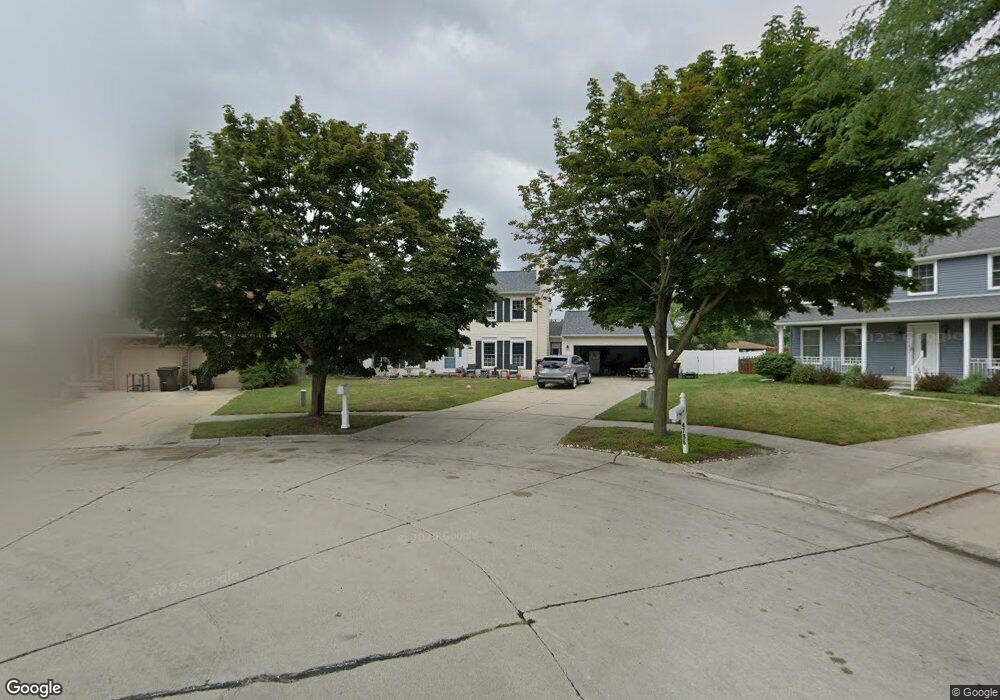
4796 Lisa Ct Unit Bldg-Unit Trenton, MI 48183
Estimated Value: $272,000 - $331,166
--
Bed
3
Baths
1,632
Sq Ft
$180/Sq Ft
Est. Value
About This Home
This home is located at 4796 Lisa Ct Unit Bldg-Unit, Trenton, MI 48183 and is currently estimated at $293,792, approximately $180 per square foot. 4796 Lisa Ct Unit Bldg-Unit is a home located in Wayne County with nearby schools including Oscar A. Carlson High School and Calvary Christian Academy.
Ownership History
Date
Name
Owned For
Owner Type
Purchase Details
Closed on
Feb 21, 2025
Sold by
Veltkamp Levi
Bought by
Veltkamp Levi and Veltkamp Keeli
Current Estimated Value
Home Financials for this Owner
Home Financials are based on the most recent Mortgage that was taken out on this home.
Original Mortgage
$262,385
Outstanding Balance
$260,832
Interest Rate
6.93%
Mortgage Type
New Conventional
Estimated Equity
$32,960
Purchase Details
Closed on
Sep 4, 2020
Sold by
Freel Anthony
Bought by
Pringle Thomas and Pringle Nicole
Purchase Details
Closed on
Sep 1, 2020
Sold by
Hunt Stacey Nicole and Freel Stacey
Bought by
Freel Anthony
Purchase Details
Closed on
Jun 24, 2020
Sold by
Hunt Stacey Nicole
Bought by
Freel Anthony
Purchase Details
Closed on
Mar 5, 2018
Sold by
Dumais Steven A and Dumais Pamela A
Bought by
Freel Anthony C
Create a Home Valuation Report for This Property
The Home Valuation Report is an in-depth analysis detailing your home's value as well as a comparison with similar homes in the area
Home Values in the Area
Average Home Value in this Area
Purchase History
| Date | Buyer | Sale Price | Title Company |
|---|---|---|---|
| Veltkamp Levi | -- | Premier Title | |
| Veltkamp Levi | $270,500 | Michigan Title Insurance Agenc | |
| Veltkamp Levi | $270,500 | Michigan Title Insurance Agenc | |
| Pringle Thomas | $242,900 | Madison Settlement Svcs Llc | |
| Freel Anthony | -- | Madison Settlement Svcs Llc | |
| Freel Anthony | -- | None Available | |
| Freel Anthony C | $205,000 | First Amer Title Ins Co |
Source: Public Records
Mortgage History
| Date | Status | Borrower | Loan Amount |
|---|---|---|---|
| Open | Veltkamp Levi | $262,385 | |
| Closed | Veltkamp Levi | $262,385 |
Source: Public Records
Tax History Compared to Growth
Tax History
| Year | Tax Paid | Tax Assessment Tax Assessment Total Assessment is a certain percentage of the fair market value that is determined by local assessors to be the total taxable value of land and additions on the property. | Land | Improvement |
|---|---|---|---|---|
| 2025 | $5,431 | $169,000 | $0 | $0 |
| 2024 | $5,431 | $159,100 | $0 | $0 |
| 2023 | $5,092 | $136,200 | $0 | $0 |
| 2022 | $6,924 | $125,800 | $0 | $0 |
| 2021 | $6,693 | $115,000 | $0 | $0 |
| 2020 | $6,877 | $108,200 | $0 | $0 |
| 2019 | $6,160 | $102,900 | $0 | $0 |
| 2018 | $2,983 | $93,400 | $0 | $0 |
| 2017 | $2,583 | $89,300 | $0 | $0 |
| 2016 | $4,028 | $87,100 | $0 | $0 |
| 2015 | $7,124 | $79,700 | $0 | $0 |
| 2013 | $6,902 | $73,300 | $0 | $0 |
| 2012 | $3,691 | $68,700 | $15,200 | $53,500 |
Source: Public Records
Map
Nearby Homes
- 25260 Reeck Rd
- 25419 Montebello Dr
- 4641 Leisure Ln
- 25525 Montebello Ct
- 5056 Lisa Ct
- 25066 Maywood St
- 4986 Jackson St
- 4687 Jackson St
- 5035 Hillcrest Ct
- 4843 Valley Rd
- 19043 Hyde Park Dr
- 19117 Hyde Park Ct
- 3249 Van Horn Rd
- 3245 Van Horn Rd
- 24995 Allen Rd
- 4600 Dolores Dr
- 5123 Argonne St
- 5498 Greenway Dr Unit 47
- 5580 Elmhurst Dr Unit 183
- 3281 Brookshire St
- 4786 Lisa Ct
- 4826 Lisa Ct
- 25620 Reeck Rd
- 4571 Leisure Ln
- 25652 Reeck Rd
- 4775 Lisa Ct
- 25632 Reeck Rd
- 4836 Lisa Ct
- 4565 Leisure Ln
- 4569 Leisure Ln
- 4569 Leisure Ln Unit 77
- 25664 Reeck Rd
- 4563 Leisure Ln Unit 75
- 4561 Leisure Ln Unit 74
- 4555 Leisure Ln Unit 73
- 4575 Leisure Ln
- 25676 Reeck Rd
- 4553 Leisure Ln Unit Bldg-Unit
- 4553 Leisure Ln Unit 72
- 4573 Leisure Ln