47W130 Primrose Ln Hampshire, IL 60140
Henpeck NeighborhoodEstimated Value: $464,000 - $502,000
4
Beds
3
Baths
2,537
Sq Ft
$192/Sq Ft
Est. Value
About This Home
This home is located at 47W130 Primrose Ln, Hampshire, IL 60140 and is currently estimated at $488,343, approximately $192 per square foot. 47W130 Primrose Ln is a home located in Kane County with nearby schools including Gary D. Wright Elementary School, Hampshire Middle School, and Hampshire High School.
Ownership History
Date
Name
Owned For
Owner Type
Purchase Details
Closed on
Nov 16, 2017
Sold by
Mccoy Frank E and Mccoy Catherine M
Bought by
Buterbaugh Paul John and Buterbaugh Tracy
Current Estimated Value
Home Financials for this Owner
Home Financials are based on the most recent Mortgage that was taken out on this home.
Original Mortgage
$308,750
Outstanding Balance
$262,189
Interest Rate
4.37%
Mortgage Type
New Conventional
Estimated Equity
$226,154
Purchase Details
Closed on
Nov 26, 2013
Sold by
Mccoy Frank E and Mccoy Catherine M
Bought by
Mccoy Frank E and Mccoy Catherine M
Purchase Details
Closed on
Jul 28, 2000
Sold by
Macmillan John D and Macmillan Bonnie L
Bought by
Mccoy Frank E and Mccoy Catherine M
Home Financials for this Owner
Home Financials are based on the most recent Mortgage that was taken out on this home.
Original Mortgage
$216,000
Interest Rate
8.19%
Create a Home Valuation Report for This Property
The Home Valuation Report is an in-depth analysis detailing your home's value as well as a comparison with similar homes in the area
Home Values in the Area
Average Home Value in this Area
Purchase History
| Date | Buyer | Sale Price | Title Company |
|---|---|---|---|
| Buterbaugh Paul John | $325,000 | Chicago Title Ins Co | |
| Mccoy Frank E | -- | None Available | |
| Mccoy Frank E | $270,000 | Universal Title Services Inc |
Source: Public Records
Mortgage History
| Date | Status | Borrower | Loan Amount |
|---|---|---|---|
| Open | Buterbaugh Paul John | $308,750 | |
| Previous Owner | Mccoy Frank E | $216,000 |
Source: Public Records
Tax History Compared to Growth
Tax History
| Year | Tax Paid | Tax Assessment Tax Assessment Total Assessment is a certain percentage of the fair market value that is determined by local assessors to be the total taxable value of land and additions on the property. | Land | Improvement |
|---|---|---|---|---|
| 2024 | $8,844 | $138,067 | $29,885 | $108,182 |
| 2023 | $8,438 | $124,194 | $26,882 | $97,312 |
| 2022 | $8,042 | $114,138 | $24,705 | $89,433 |
| 2021 | $7,633 | $106,036 | $23,304 | $82,732 |
| 2020 | $7,504 | $103,138 | $22,667 | $80,471 |
| 2019 | $7,408 | $99,766 | $21,926 | $77,840 |
| 2018 | $7,242 | $94,261 | $20,716 | $73,545 |
| 2017 | $7,032 | $90,531 | $19,896 | $70,635 |
| 2016 | $6,915 | $85,102 | $18,703 | $66,399 |
| 2015 | -- | $79,099 | $17,384 | $61,715 |
| 2014 | -- | $76,491 | $16,811 | $59,680 |
| 2013 | -- | $81,382 | $17,886 | $63,496 |
Source: Public Records
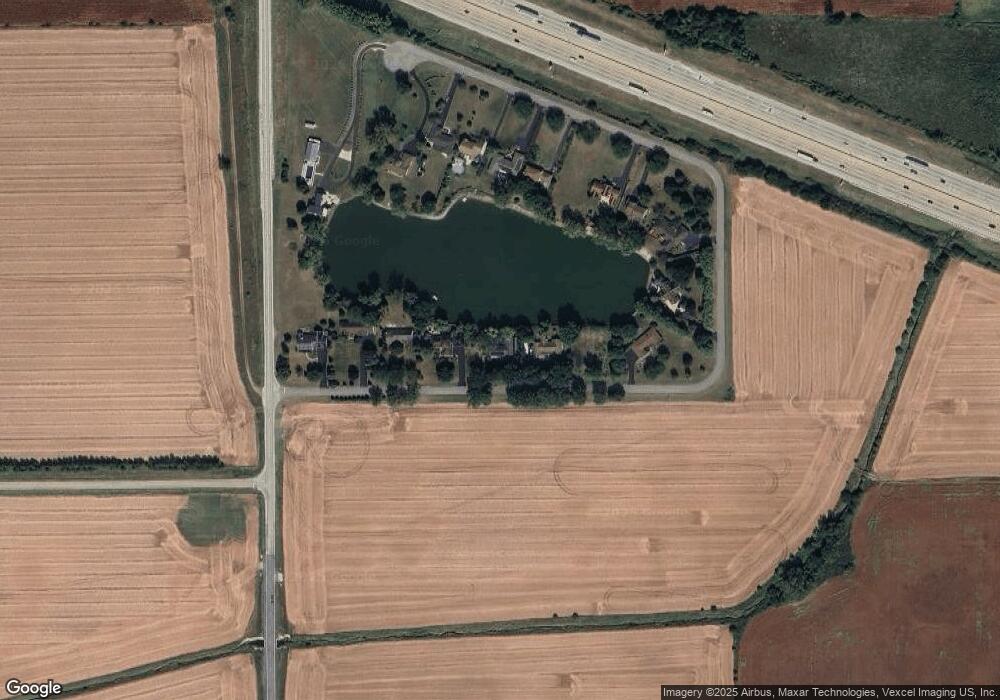
Map
Nearby Homes
- 0 Higgins Rd Unit Lot WP001 14289295
- 0000 Higgins Rd
- LOT 3 Henry St
- Lot 4 Henry St
- 19N053 Felsmith Rd
- 11210 Pebble Dr
- 15610 Botterman Rd
- 15604 Botterman Rd
- 10817 Hill Crest Ln
- 116 Cornerstone Crossing
- 15510 Botterman Rd
- Sloan Plan at Prairie Ridge - Traditional Single Family
- SIENNA Plan at Prairie Ridge - Traditional Single Family
- SYDNEY Plan at Prairie Ridge - Traditional Single Family
- HENLEY Plan at Prairie Ridge - Traditional Single Family
- Haven Plan at Prairie Ridge - Traditional Single Family
- Meridian Plan at Prairie Ridge - Traditional Single Family
- BELLAMY Plan at Prairie Ridge - Traditional Single Family
- 0 Church Rd Unit MRD12107441
- 104 Cornerstone Crossing
- 47W100 Primrose Ln
- 47W158 Primrose Ln
- 47W190 Primrose Ln
- 47W210 Primrose Ln
- 47W040 Primrose Ln
- 7 Primrose Ln
- 47W244 Primrose Ln
- 47w Primrose Ln
- 47W093 Briarwood Ln
- 19N592 Hawthorne Ln
- 47W059 Briarwood Ln
- 47W115 Briarwood Ln
- 47W137 Briarwood Ln
- Lot 7 Primrose Ln
- 47W078 Primrose Ln
- 47W187 Briarwood Ln
- 47W155 Briarwood Ln
- 19N640 Hawthorne Ln
- 47W217 Briarwood Ln
- 47w Briarwood Ln