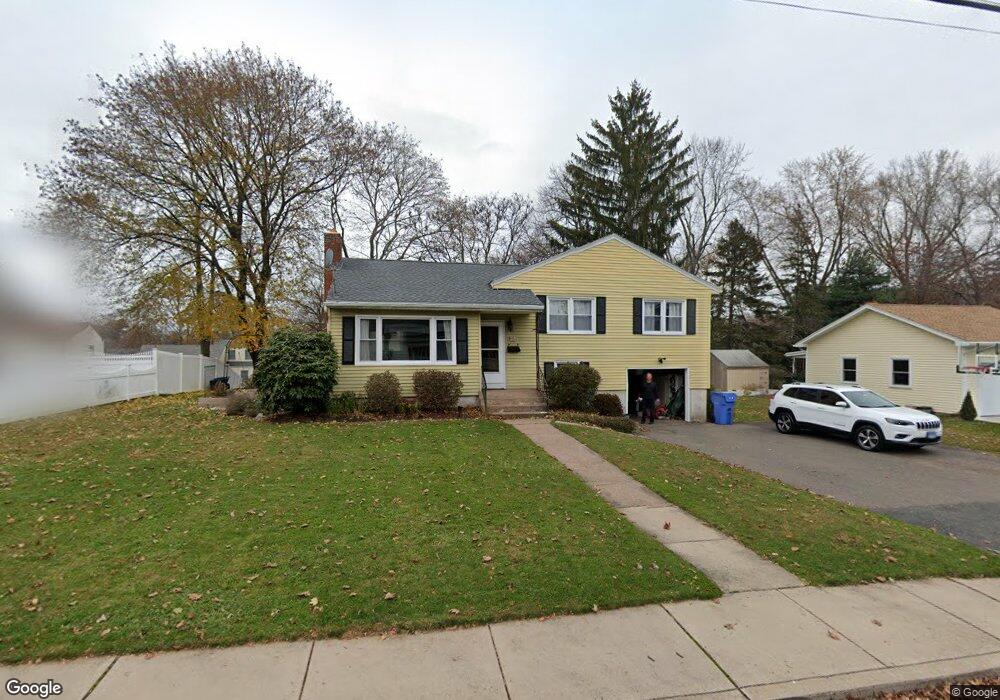
48 Agnes Dr Manchester, CT 06042
Buckley District NeighborhoodEstimated Value: $299,000 - $317,827
3
Beds
1
Bath
1,163
Sq Ft
$266/Sq Ft
Est. Value
About This Home
This home is located at 48 Agnes Dr, Manchester, CT 06042 and is currently estimated at $308,957, approximately $265 per square foot. 48 Agnes Dr is a home located in Hartford County with nearby schools including Buckley School, Illing Middle School, and Elisabeth M. Bennet Academy.
Ownership History
Date
Name
Owned For
Owner Type
Purchase Details
Closed on
Mar 4, 2005
Sold by
James Augustin
Bought by
Rutigliano Tiffany L and Buzzell Shane A
Current Estimated Value
Home Financials for this Owner
Home Financials are based on the most recent Mortgage that was taken out on this home.
Original Mortgage
$206,350
Interest Rate
5.66%
Purchase Details
Closed on
Oct 22, 2004
Sold by
Household Realty Corp
Bought by
Augustin James
Create a Home Valuation Report for This Property
The Home Valuation Report is an in-depth analysis detailing your home's value as well as a comparison with similar homes in the area
Home Values in the Area
Average Home Value in this Area
Purchase History
| Date | Buyer | Sale Price | Title Company |
|---|---|---|---|
| Rutigliano Tiffany L | $208,000 | -- | |
| Rutigliano Tiffany L | $208,000 | -- | |
| Augustin James | $155,000 | -- | |
| Augustin James | $155,000 | -- |
Source: Public Records
Mortgage History
| Date | Status | Borrower | Loan Amount |
|---|---|---|---|
| Open | Augustin James | $176,938 | |
| Closed | Augustin James | $206,350 |
Source: Public Records
Tax History Compared to Growth
Tax History
| Year | Tax Paid | Tax Assessment Tax Assessment Total Assessment is a certain percentage of the fair market value that is determined by local assessors to be the total taxable value of land and additions on the property. | Land | Improvement |
|---|---|---|---|---|
| 2025 | $5,392 | $135,400 | $39,100 | $96,300 |
| 2024 | $5,237 | $135,400 | $39,100 | $96,300 |
| 2023 | $5,037 | $135,400 | $39,100 | $96,300 |
| 2022 | $4,891 | $135,400 | $39,100 | $96,300 |
| 2021 | $4,608 | $109,900 | $33,600 | $76,300 |
| 2020 | $4,602 | $109,900 | $33,600 | $76,300 |
| 2019 | $4,583 | $109,900 | $33,600 | $76,300 |
| 2018 | $4,496 | $109,900 | $33,600 | $76,300 |
| 2017 | $4,369 | $109,900 | $33,600 | $76,300 |
| 2016 | $4,559 | $114,900 | $42,700 | $72,200 |
| 2015 | $4,527 | $114,900 | $42,700 | $72,200 |
| 2014 | $4,441 | $114,900 | $42,700 | $72,200 |
Source: Public Records
Map
Nearby Homes