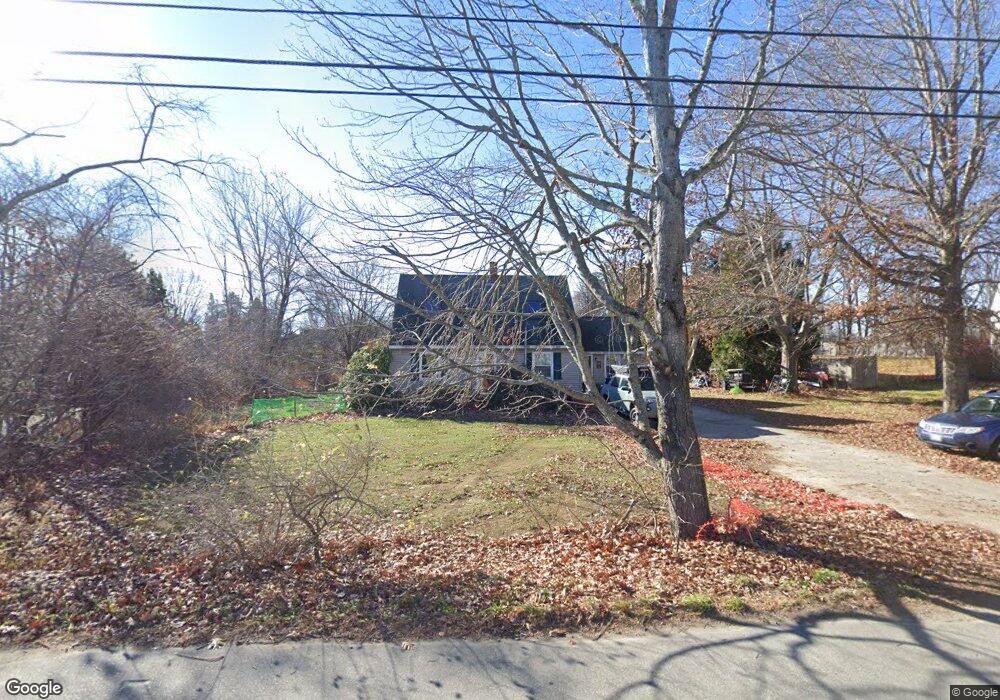
48 Berry Rd Saco, ME 04072
North Saco NeighborhoodEstimated Value: $477,226 - $528,000
3
Beds
2
Baths
1,428
Sq Ft
$350/Sq Ft
Est. Value
About This Home
This home is located at 48 Berry Rd, Saco, ME 04072 and is currently estimated at $499,307, approximately $349 per square foot. 48 Berry Rd is a home located in York County with nearby schools including C K Burns School, Saco Middle School, and Saint James School.
Ownership History
Date
Name
Owned For
Owner Type
Purchase Details
Closed on
Sep 11, 2007
Sold by
Mathieu Carrie A
Bought by
Robbins Cynthia A and Robbins William L
Current Estimated Value
Home Financials for this Owner
Home Financials are based on the most recent Mortgage that was taken out on this home.
Original Mortgage
$196,250
Outstanding Balance
$125,326
Interest Rate
6.65%
Mortgage Type
FHA
Estimated Equity
$373,981
Create a Home Valuation Report for This Property
The Home Valuation Report is an in-depth analysis detailing your home's value as well as a comparison with similar homes in the area
Home Values in the Area
Average Home Value in this Area
Purchase History
| Date | Buyer | Sale Price | Title Company |
|---|---|---|---|
| Robbins Cynthia A | -- | -- |
Source: Public Records
Mortgage History
| Date | Status | Borrower | Loan Amount |
|---|---|---|---|
| Open | Robbins Cynthia A | $15,000 | |
| Open | Robbins Cynthia A | $196,250 |
Source: Public Records
Tax History Compared to Growth
Tax History
| Year | Tax Paid | Tax Assessment Tax Assessment Total Assessment is a certain percentage of the fair market value that is determined by local assessors to be the total taxable value of land and additions on the property. | Land | Improvement |
|---|---|---|---|---|
| 2024 | $4,923 | $350,400 | $143,200 | $207,200 |
| 2023 | $5,168 | $350,400 | $143,200 | $207,200 |
| 2022 | $4,656 | $254,000 | $109,000 | $145,000 |
| 2021 | $4,463 | $236,400 | $97,700 | $138,700 |
| 2020 | $4,176 | $212,300 | $86,000 | $126,300 |
| 2019 | $4,114 | $212,300 | $86,000 | $126,300 |
| 2018 | $3,963 | $204,500 | $78,200 | $126,300 |
| 2017 | $3,293 | $189,900 | $71,200 | $118,700 |
| 2016 | $3,161 | $172,200 | $54,900 | $117,300 |
| 2015 | $3,281 | $170,700 | $54,900 | $115,800 |
| 2014 | $3,178 | $170,700 | $54,900 | $115,800 |
| 2013 | $3,172 | $170,700 | $54,900 | $115,800 |
Source: Public Records
Map
Nearby Homes