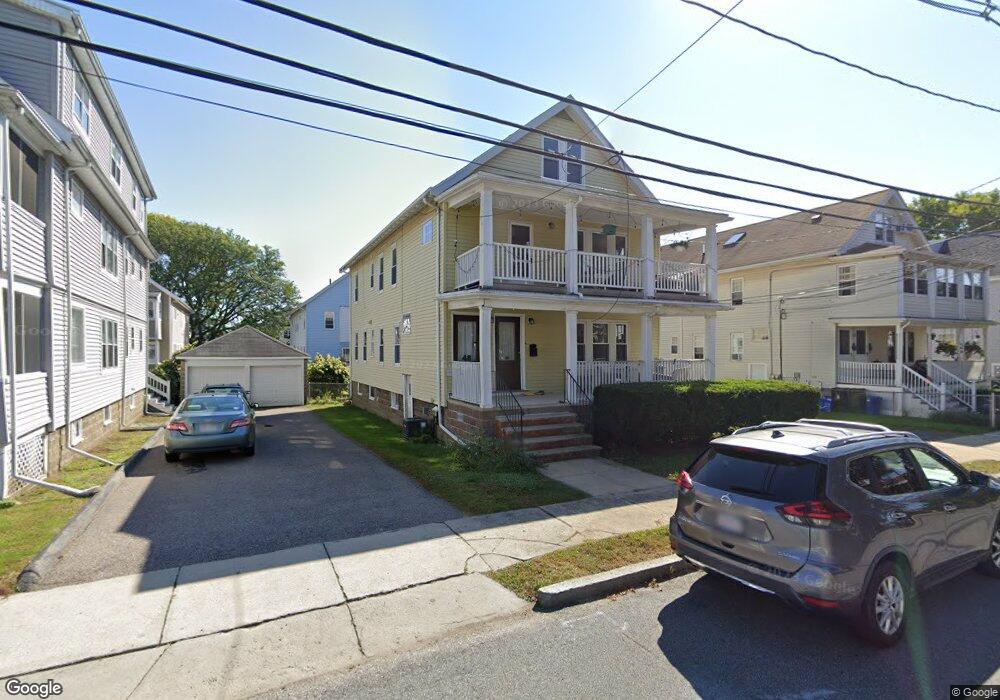
48 Egerton Rd Unit 50 Arlington, MA 02474
East Arlington NeighborhoodEstimated Value: $1,208,000 - $1,505,663
4
Beds
2
Baths
2,503
Sq Ft
$541/Sq Ft
Est. Value
About This Home
This home is located at 48 Egerton Rd Unit 50, Arlington, MA 02474 and is currently estimated at $1,355,166, approximately $541 per square foot. 48 Egerton Rd Unit 50 is a home located in Middlesex County with nearby schools including Hardy Elementary School, Ottoson Middle School, and Arlington High School.
Ownership History
Date
Name
Owned For
Owner Type
Purchase Details
Closed on
Dec 27, 2019
Sold by
Velonias Platon G and Lampros Maria
Bought by
Velonias Lampros Ret and Lampros
Current Estimated Value
Purchase Details
Closed on
Jul 28, 2004
Sold by
Velonias Platon G
Bought by
Lampros Maria and Velonias Planton G
Home Financials for this Owner
Home Financials are based on the most recent Mortgage that was taken out on this home.
Original Mortgage
$420,000
Interest Rate
6.28%
Mortgage Type
Purchase Money Mortgage
Purchase Details
Closed on
Jul 22, 2004
Sold by
Caliri Jenny S and Moison Jenny S
Bought by
Velonias Platon G
Home Financials for this Owner
Home Financials are based on the most recent Mortgage that was taken out on this home.
Original Mortgage
$420,000
Interest Rate
6.28%
Mortgage Type
Purchase Money Mortgage
Purchase Details
Closed on
Sep 23, 1994
Sold by
Thompson Susan and Buttner Patricia
Bought by
Moison Jenny S
Home Financials for this Owner
Home Financials are based on the most recent Mortgage that was taken out on this home.
Original Mortgage
$188,500
Interest Rate
8.56%
Mortgage Type
Purchase Money Mortgage
Create a Home Valuation Report for This Property
The Home Valuation Report is an in-depth analysis detailing your home's value as well as a comparison with similar homes in the area
Home Values in the Area
Average Home Value in this Area
Purchase History
| Date | Buyer | Sale Price | Title Company |
|---|---|---|---|
| Velonias Lampros Ret | -- | None Available | |
| Lampros Maria | -- | -- | |
| Velonias Platon G | $626,000 | -- | |
| Moison Jenny S | $209,500 | -- |
Source: Public Records
Mortgage History
| Date | Status | Borrower | Loan Amount |
|---|---|---|---|
| Previous Owner | Velonias Platon G | $420,000 | |
| Previous Owner | Moison Jenny S | $185,000 | |
| Previous Owner | Moison Jenny S | $188,500 |
Source: Public Records
Tax History Compared to Growth
Tax History
| Year | Tax Paid | Tax Assessment Tax Assessment Total Assessment is a certain percentage of the fair market value that is determined by local assessors to be the total taxable value of land and additions on the property. | Land | Improvement |
|---|---|---|---|---|
| 2025 | $12,311 | $1,143,100 | $591,200 | $551,900 |
| 2024 | $11,379 | $1,074,500 | $562,800 | $511,700 |
| 2023 | $11,457 | $1,022,000 | $471,900 | $550,100 |
| 2022 | $11,420 | $1,000,000 | $454,800 | $545,200 |
| 2021 | $11,059 | $975,200 | $454,800 | $520,400 |
| 2020 | $10,788 | $975,400 | $454,800 | $520,600 |
| 2019 | $9,833 | $873,300 | $483,200 | $390,100 |
| 2018 | $9,008 | $742,600 | $352,500 | $390,100 |
| 2017 | $8,877 | $706,800 | $307,000 | $399,800 |
| 2016 | $8,465 | $661,300 | $261,500 | $399,800 |
| 2015 | $8,303 | $612,800 | $255,800 | $357,000 |
Source: Public Records
Map
Nearby Homes
- 215 Massachusetts Ave Unit 19 (34)
- 230 Massachusetts Ave Unit 6
- 128 Thorndike St Unit 2
- 137-139 Thorndike St Unit 2
- 22 Hamilton Rd Unit 206
- 3 Seagrave Rd
- 18 Belknap St Unit 2
- 18 Belknap St Unit 1
- 34 Hamilton Rd Unit 302
- 31 Mott St Unit 31A
- 25-27 Adams St
- 57 Garrison Ave
- 42-44 Warren St Unit 42
- 23 Brookford St
- 23 Brookford St Unit 2
- 23 Brookford St Unit 1
- 19 Cottage Park Ave
- 127 Harvey St
- 127 Harvey St Unit 127
- 41 Palmer St Unit 43
- 52 Egerton Rd Unit 54
- 52 Egerton Rd Unit 2
- 46 Egerton Rd Unit 1
- 44 Egerton Rd Unit 46
- 44 Egerton Rd Unit 1
- 44 Egerton Rd
- 47 Melrose St Unit 49
- 47 Melrose St Unit 47
- 47-49 Melrose St
- 49 Melrose St
- 58 Egerton Rd Unit 58
- 58 Egerton Rd
- 51 Melrose St
- 40 Egerton Rd
- 43 Melrose St Unit 45
- 43 Melrose St Unit 1
- 51 Egerton Rd Unit 53
- 51 Egerton Rd Unit 2
- 38 Egerton Rd Unit 40
- 38 Egerton Rd Unit 38