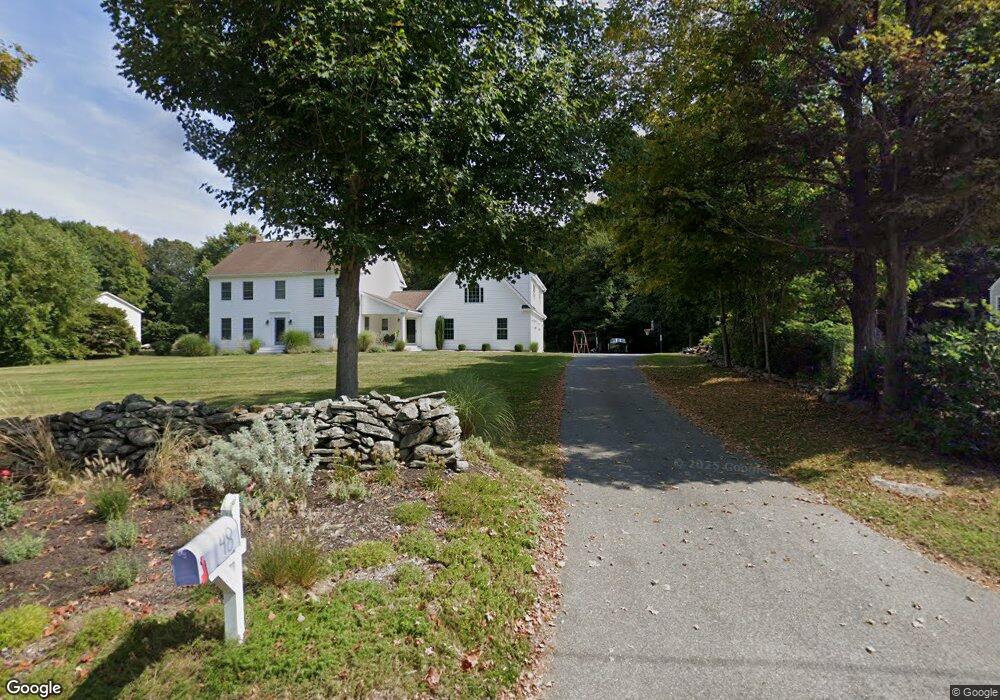
48 Pleasant St Chester, CT 06412
Estimated Value: $726,000 - $927,000
4
Beds
3
Baths
3,103
Sq Ft
$272/Sq Ft
Est. Value
About This Home
This home is located at 48 Pleasant St, Chester, CT 06412 and is currently estimated at $842,834, approximately $271 per square foot. 48 Pleasant St is a home located in Middlesex County with nearby schools including Valley Regional High School.
Ownership History
Date
Name
Owned For
Owner Type
Purchase Details
Closed on
May 8, 2007
Sold by
Strauss Leslie
Bought by
Rice Eric and Rice Abigail
Current Estimated Value
Purchase Details
Closed on
Mar 15, 2006
Sold by
Hubbard Karen
Bought by
Strauss Leslie
Create a Home Valuation Report for This Property
The Home Valuation Report is an in-depth analysis detailing your home's value as well as a comparison with similar homes in the area
Home Values in the Area
Average Home Value in this Area
Purchase History
| Date | Buyer | Sale Price | Title Company |
|---|---|---|---|
| Rice Eric | $111,000 | -- | |
| Rice Eric | $111,000 | -- | |
| Strauss Leslie | $125,000 | -- | |
| Strauss Leslie | $125,000 | -- |
Source: Public Records
Mortgage History
| Date | Status | Borrower | Loan Amount |
|---|---|---|---|
| Open | Strauss Leslie | $380,000 | |
| Closed | Strauss Leslie | $397,000 | |
| Closed | Strauss Leslie | $414,500 |
Source: Public Records
Tax History Compared to Growth
Tax History
| Year | Tax Paid | Tax Assessment Tax Assessment Total Assessment is a certain percentage of the fair market value that is determined by local assessors to be the total taxable value of land and additions on the property. | Land | Improvement |
|---|---|---|---|---|
| 2025 | $10,818 | $399,490 | $59,360 | $340,130 |
| 2024 | $9,768 | $399,490 | $59,360 | $340,130 |
| 2023 | $8,669 | $291,880 | $59,360 | $232,520 |
| 2022 | $8,610 | $291,880 | $59,360 | $232,520 |
| 2021 | $8,610 | $291,880 | $59,360 | $232,520 |
| 2020 | $8,354 | $291,880 | $59,360 | $232,520 |
| 2019 | $8,403 | $291,880 | $59,360 | $232,520 |
| 2018 | $4,419 | $293,930 | $62,660 | $231,270 |
| 2017 | $4,567 | $293,930 | $62,660 | $231,270 |
| 2016 | $5,926 | $293,930 | $62,660 | $231,270 |
| 2015 | $7,442 | $293,930 | $62,660 | $231,270 |
| 2014 | $7,295 | $293,930 | $62,660 | $231,270 |
Source: Public Records
Map
Nearby Homes