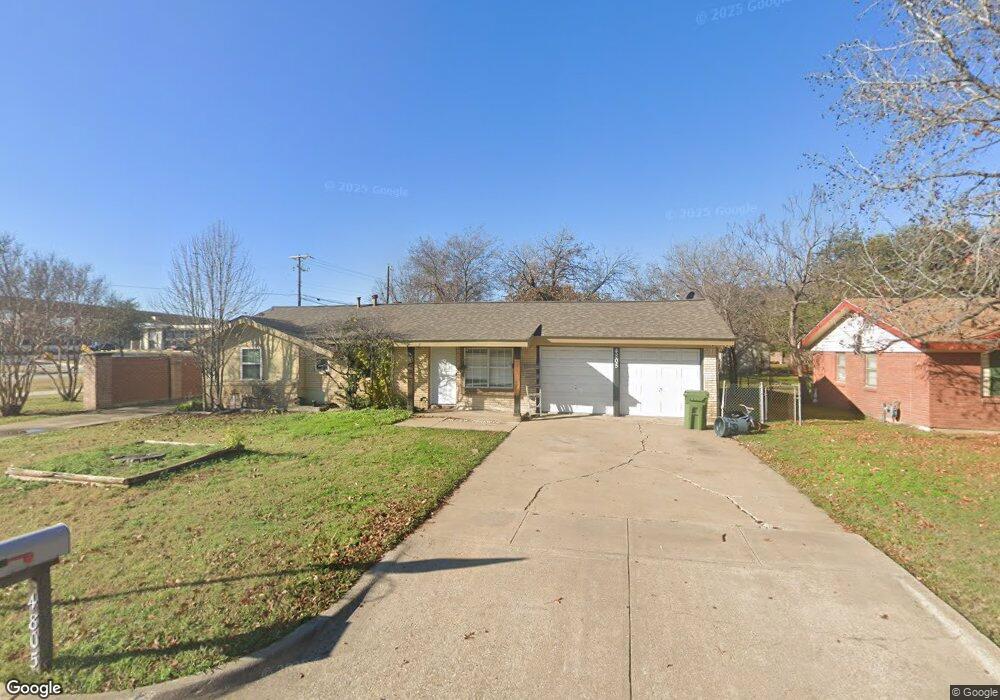
4805 Colorado Blvd North Richland Hills, TX 76180
Estimated Value: $272,000 - $316,000
3
Beds
2
Baths
1,819
Sq Ft
$162/Sq Ft
Est. Value
About This Home
This home is located at 4805 Colorado Blvd, North Richland Hills, TX 76180 and is currently estimated at $295,354, approximately $162 per square foot. 4805 Colorado Blvd is a home located in Tarrant County with nearby schools including Jack C Binion Elementary School, Richland Middle School, and Birdville High School.
Ownership History
Date
Name
Owned For
Owner Type
Purchase Details
Closed on
Jun 24, 2013
Sold by
Ramirez Francisco J and Ramirez Judith
Bought by
Chavez Simon and Chavez Disifredo
Current Estimated Value
Purchase Details
Closed on
Jan 5, 2000
Sold by
Simpson Jerry and Simpson Jeff
Bought by
Ramirez Francis J and Ramirez Judith
Home Financials for this Owner
Home Financials are based on the most recent Mortgage that was taken out on this home.
Original Mortgage
$79,859
Interest Rate
7.84%
Mortgage Type
FHA
Purchase Details
Closed on
Jul 1, 1999
Sold by
Hansard Rufus C and Hansard Virginia
Bought by
Simmons Jerry and Simmons Jeff
Home Financials for this Owner
Home Financials are based on the most recent Mortgage that was taken out on this home.
Original Mortgage
$52,800
Interest Rate
7.21%
Create a Home Valuation Report for This Property
The Home Valuation Report is an in-depth analysis detailing your home's value as well as a comparison with similar homes in the area
Home Values in the Area
Average Home Value in this Area
Purchase History
| Date | Buyer | Sale Price | Title Company |
|---|---|---|---|
| Chavez Simon | -- | None Available | |
| Ramirez Francis J | -- | Rattikin Title Co | |
| Simmons Jerry | -- | Rattikin Title Co |
Source: Public Records
Mortgage History
| Date | Status | Borrower | Loan Amount |
|---|---|---|---|
| Previous Owner | Ramirez Francis J | $79,859 | |
| Previous Owner | Simmons Jerry | $52,800 |
Source: Public Records
Tax History Compared to Growth
Tax History
| Year | Tax Paid | Tax Assessment Tax Assessment Total Assessment is a certain percentage of the fair market value that is determined by local assessors to be the total taxable value of land and additions on the property. | Land | Improvement |
|---|---|---|---|---|
| 2025 | $5,384 | $228,281 | $55,000 | $173,281 |
| 2024 | $5,384 | $248,131 | $55,000 | $193,131 |
| 2023 | $4,936 | $225,000 | $55,000 | $170,000 |
| 2022 | $4,975 | $206,756 | $25,000 | $181,756 |
| 2021 | $3,835 | $150,707 | $25,000 | $125,707 |
| 2020 | $3,026 | $118,942 | $25,000 | $93,942 |
| 2019 | $3,132 | $118,942 | $25,000 | $93,942 |
| 2018 | $3,107 | $118,000 | $25,000 | $93,000 |
| 2017 | $3,363 | $125,000 | $25,000 | $100,000 |
| 2016 | $3,256 | $121,000 | $15,000 | $106,000 |
| 2015 | $2,251 | $83,800 | $12,000 | $71,800 |
| 2014 | $2,251 | $83,800 | $12,000 | $71,800 |
Source: Public Records
Map
Nearby Homes
- 7908 Lazy Lane Rd
- 8020 Laura St
- 5020 Colorado Blvd
- 5016 Wyoming Trail
- 5113 Bob Dr
- 7800 Arnold Terrace
- 4304 Lynn Terrace
- 5304 Colorado Blvd
- Dalton II Plan at City Point
- Zoe Plan at City Point
- Hampton Plan at City Point
- Conrad Plan at City Point
- 4357 Union St
- 4916 Susan Lee Ln
- 4352 Henderson Ave
- 4209 Ashmore Dr
- 4540 Ward St
- 7801 Conn Dr
- 4529 Ward St
- 7717 Janetta Dr
- 4809 Colorado Blvd
- 4804 Grove St
- 4808 Grove St
- 4813 Colorado Blvd
- 4804 Colorado Blvd
- 4812 Grove St
- 4808 Colorado Blvd
- 4817 Colorado Blvd
- 4812 Colorado Blvd
- 4816 Grove St
- 4816 Colorado Blvd
- 4821 Colorado Blvd
- 4805 Wyoming Trail
- 4809 Wyoming Trail
- 4809 Grove St
- 4820 Grove St
- 4813 Wyoming Trail
- 8000 Bedford Euless Rd
- 4813 Grove St
- 4817 Wyoming Trail