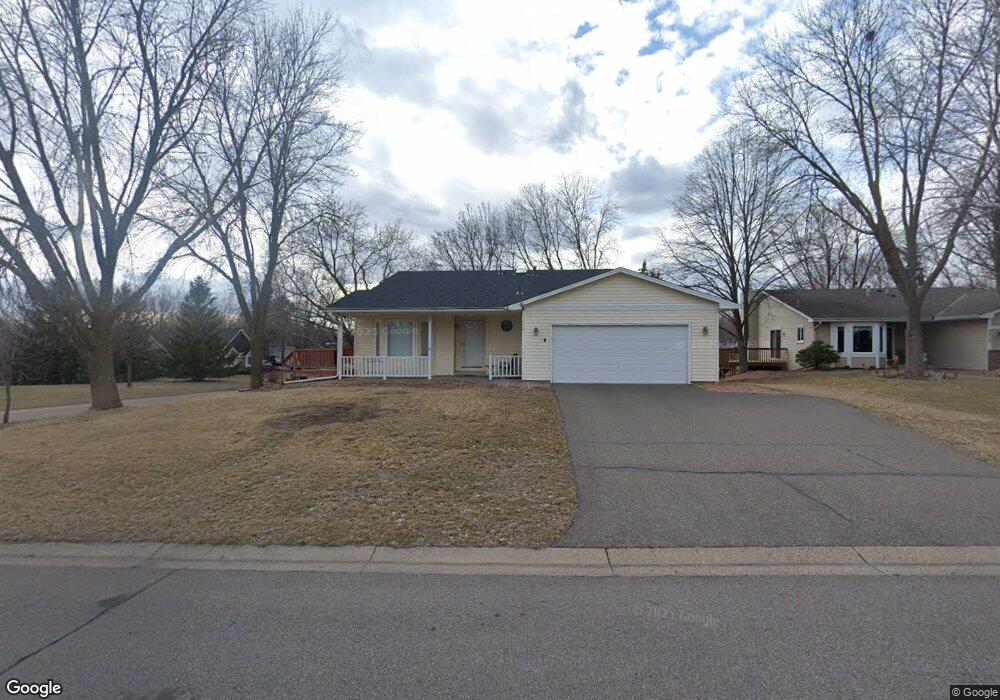
4805 Saratoga Ln N Plymouth, MN 55442
Estimated Value: $413,413 - $473,000
3
Beds
2
Baths
1,773
Sq Ft
$249/Sq Ft
Est. Value
About This Home
This home is located at 4805 Saratoga Ln N, Plymouth, MN 55442 and is currently estimated at $441,353, approximately $248 per square foot. 4805 Saratoga Ln N is a home located in Hennepin County with nearby schools including Zachary Lane Elementary School, Plymouth Middle School, and Armstrong High School.
Ownership History
Date
Name
Owned For
Owner Type
Purchase Details
Closed on
Mar 13, 2019
Sold by
Johnson Jeffrey Neill and Johnson Nancy Lee
Bought by
Beilke Matthew
Current Estimated Value
Home Financials for this Owner
Home Financials are based on the most recent Mortgage that was taken out on this home.
Original Mortgage
$248,000
Outstanding Balance
$218,034
Interest Rate
4.4%
Mortgage Type
New Conventional
Estimated Equity
$223,319
Purchase Details
Closed on
Jun 27, 2003
Sold by
Christiansen Mark E and Christiansen Jody L
Bought by
Mccormick Daisy R
Purchase Details
Closed on
Jul 31, 2000
Sold by
Johnson Brian R and Johnson Jennifer B
Bought by
Christiansen Mark E and Christiansen Jody L
Purchase Details
Closed on
Nov 14, 1995
Sold by
Nielsen James J
Bought by
Johnson Brian R
Create a Home Valuation Report for This Property
The Home Valuation Report is an in-depth analysis detailing your home's value as well as a comparison with similar homes in the area
Home Values in the Area
Average Home Value in this Area
Purchase History
| Date | Buyer | Sale Price | Title Company |
|---|---|---|---|
| Beilke Matthew | $310,000 | Edina Realty Title Inc | |
| Mccormick Daisy R | $249,900 | -- | |
| Christiansen Mark E | $189,900 | -- | |
| Johnson Brian R | $135,000 | -- |
Source: Public Records
Mortgage History
| Date | Status | Borrower | Loan Amount |
|---|---|---|---|
| Open | Beilke Matthew | $248,000 |
Source: Public Records
Tax History Compared to Growth
Tax History
| Year | Tax Paid | Tax Assessment Tax Assessment Total Assessment is a certain percentage of the fair market value that is determined by local assessors to be the total taxable value of land and additions on the property. | Land | Improvement |
|---|---|---|---|---|
| 2024 | $4,226 | $369,600 | $115,000 | $254,600 |
| 2023 | $4,014 | $358,100 | $105,000 | $253,100 |
| 2022 | $3,749 | $360,000 | $113,000 | $247,000 |
| 2021 | $3,607 | $312,000 | $110,000 | $202,000 |
| 2020 | $3,476 | $301,000 | $107,000 | $194,000 |
| 2019 | $3,477 | $281,000 | $94,000 | $187,000 |
| 2018 | $3,117 | $269,000 | $91,000 | $178,000 |
| 2017 | $3,188 | $243,000 | $84,000 | $159,000 |
| 2016 | $3,372 | $243,000 | $84,000 | $159,000 |
| 2015 | $3,632 | $243,200 | $84,000 | $159,200 |
| 2014 | -- | $235,800 | $84,000 | $151,800 |
Source: Public Records
Map
Nearby Homes
- 4715 Pilgrim Ln N
- 4835 Orleans Ln N
- 4950 Valley Forge Ln N
- 4465 Trenton Ln N Unit 109
- 4755 Yorktown Ln N
- 4835 Yorktown Ln N
- 4350 Trenton Ln N Unit 200
- 4350 Trenton Ln N Unit 315
- 10600 43rd Ave N Unit 203
- 10630 Rockford Rd Unit 112
- 10630 Rockford Rd Unit 205
- 4645 Balsam Ln N
- 11282 50th Place N
- 4855 Cottonwood Ln N
- 10695 53rd Ave N
- 4230 Ximines Ln N
- 11100 52nd Ave N
- 4885 Deerwood Ln N
- 5105 Balsam Ln N
- 5304 Yorktown Ln N
- 4815 Saratoga Ln N
- 4800 Trenton Ln N
- 4810 Trenton Ln N
- 4825 Saratoga Ln N
- 4800 Saratoga Ln N
- 10405 48th Ave N
- 4810 Saratoga Ln N
- 4820 Trenton Ln N
- 10415 48th Ave N
- 4865 Saratoga Ln N
- 4805 Trenton Ln N
- 10505 48th Ave N
- 4805 Quaker Ln N
- 4870 Trenton Ln N
- 4860 Saratoga Ln N
- 4745 Quaker Ln N
- 4825 Trenton Ln N
- 4815 Quaker Ln N
- 4815 Trenton Ln N
- 10515 48th Ave N