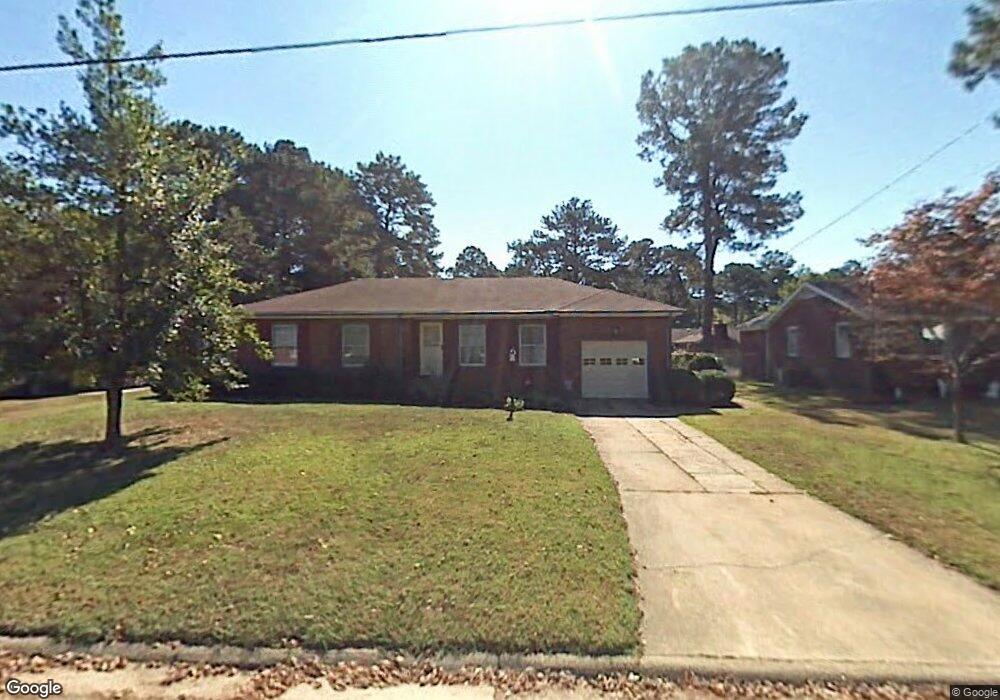
4809 Orleans Dr Portsmouth, VA 23703
Churchland NeighborhoodEstimated Value: $301,000 - $321,866
3
Beds
2
Baths
1,700
Sq Ft
$183/Sq Ft
Est. Value
About This Home
This home is located at 4809 Orleans Dr, Portsmouth, VA 23703 and is currently estimated at $310,967, approximately $182 per square foot. 4809 Orleans Dr is a home located in Portsmouth City with nearby schools including Churchland Elementary School, Churchland Academy Elementary School, and Churchland Middle School.
Ownership History
Date
Name
Owned For
Owner Type
Purchase Details
Closed on
Apr 10, 2023
Sold by
Snell Dwight H
Bought by
Gonzalez Melissa M
Current Estimated Value
Home Financials for this Owner
Home Financials are based on the most recent Mortgage that was taken out on this home.
Original Mortgage
$177,553
Outstanding Balance
$172,098
Interest Rate
6.25%
Mortgage Type
FHA
Estimated Equity
$138,869
Purchase Details
Closed on
Jan 18, 2018
Sold by
Mckinney Jennifer K
Bought by
Snell Dwight H
Home Financials for this Owner
Home Financials are based on the most recent Mortgage that was taken out on this home.
Original Mortgage
$170,445
Interest Rate
3.94%
Mortgage Type
VA
Purchase Details
Closed on
Dec 8, 2006
Sold by
Wilkins Michael A
Bought by
Mckinney Jennifer K
Home Financials for this Owner
Home Financials are based on the most recent Mortgage that was taken out on this home.
Original Mortgage
$235,638
Interest Rate
6.31%
Mortgage Type
VA
Create a Home Valuation Report for This Property
The Home Valuation Report is an in-depth analysis detailing your home's value as well as a comparison with similar homes in the area
Home Values in the Area
Average Home Value in this Area
Purchase History
| Date | Buyer | Sale Price | Title Company |
|---|---|---|---|
| Gonzalez Melissa M | $250,000 | Stewart Title | |
| Snell Dwight H | $165,000 | Priority Title & Escrow | |
| Mckinney Jennifer K | $228,000 | -- |
Source: Public Records
Mortgage History
| Date | Status | Borrower | Loan Amount |
|---|---|---|---|
| Open | Gonzalez Melissa M | $177,553 | |
| Previous Owner | Snell Dwight H | $170,445 | |
| Previous Owner | Mckinney Jennifer K | $235,638 |
Source: Public Records
Tax History Compared to Growth
Tax History
| Year | Tax Paid | Tax Assessment Tax Assessment Total Assessment is a certain percentage of the fair market value that is determined by local assessors to be the total taxable value of land and additions on the property. | Land | Improvement |
|---|---|---|---|---|
| 2025 | $3,408 | $271,100 | $77,760 | $193,340 |
| 2024 | $3,408 | $263,210 | $77,760 | $185,450 |
| 2023 | $3,114 | $249,100 | $77,760 | $171,340 |
| 2022 | $2,825 | $217,330 | $64,800 | $152,530 |
| 2021 | $2,435 | $187,340 | $46,100 | $141,240 |
| 2020 | $2,407 | $185,150 | $43,910 | $141,240 |
| 2019 | $2,391 | $183,900 | $43,910 | $139,990 |
| 2018 | $2,342 | $180,140 | $43,910 | $136,230 |
| 2017 | $2,309 | $177,630 | $43,910 | $133,720 |
| 2016 | $2,309 | $177,630 | $43,910 | $133,720 |
| 2015 | $2,309 | $177,630 | $43,910 | $133,720 |
| 2014 | $2,256 | $177,630 | $43,910 | $133,720 |
Source: Public Records
Map
Nearby Homes
- 3728 Cardinal Ln
- 10AC Cedar Ln
- 4955 Briarwood Ln
- 4959 Briarwood Ln
- 4808 Thornwood St
- 3613 Cardinal Ln
- 4613 Mallard Crescent
- 3609 Linnet Ln
- 3609 Loon Ct
- 3509 Spence Rd
- 4008 Oakhurst Rd
- 4705 Templar Dr
- 2004 Sawgrass Ln
- 3425 Cedar Ln
- 3614 Jordan Ln
- 3315 Camellia Dr
- 3405 Canterbury Dr
- 3408 Wakefield Dr
- 3832 New River Reach Unit A
- 5516 Bingham Dr
- 4805 Orleans Dr
- 4813 Orleans Dr
- 4804 Morro Blvd
- 4808 Morro Blvd
- 3904 Shannon Rd
- 4817 Orleans Dr
- 4801 Orleans Dr
- 4808 Orleans Dr
- 4812 Orleans Dr
- 3900 Shannon Rd
- 4812 Morro Blvd
- 4804 Orleans Dr
- 4816 Orleans Dr
- 4821 Orleans Dr
- 4816 Morro Blvd
- 3912 Shannon Rd
- 4820 Orleans Dr
- 4817 Wycliff Rd
- 4821 Wycliff Rd
- 4805 Morro Blvd